


The landing
If you have never flown into Congonhas, the approach is disorienting the first time.
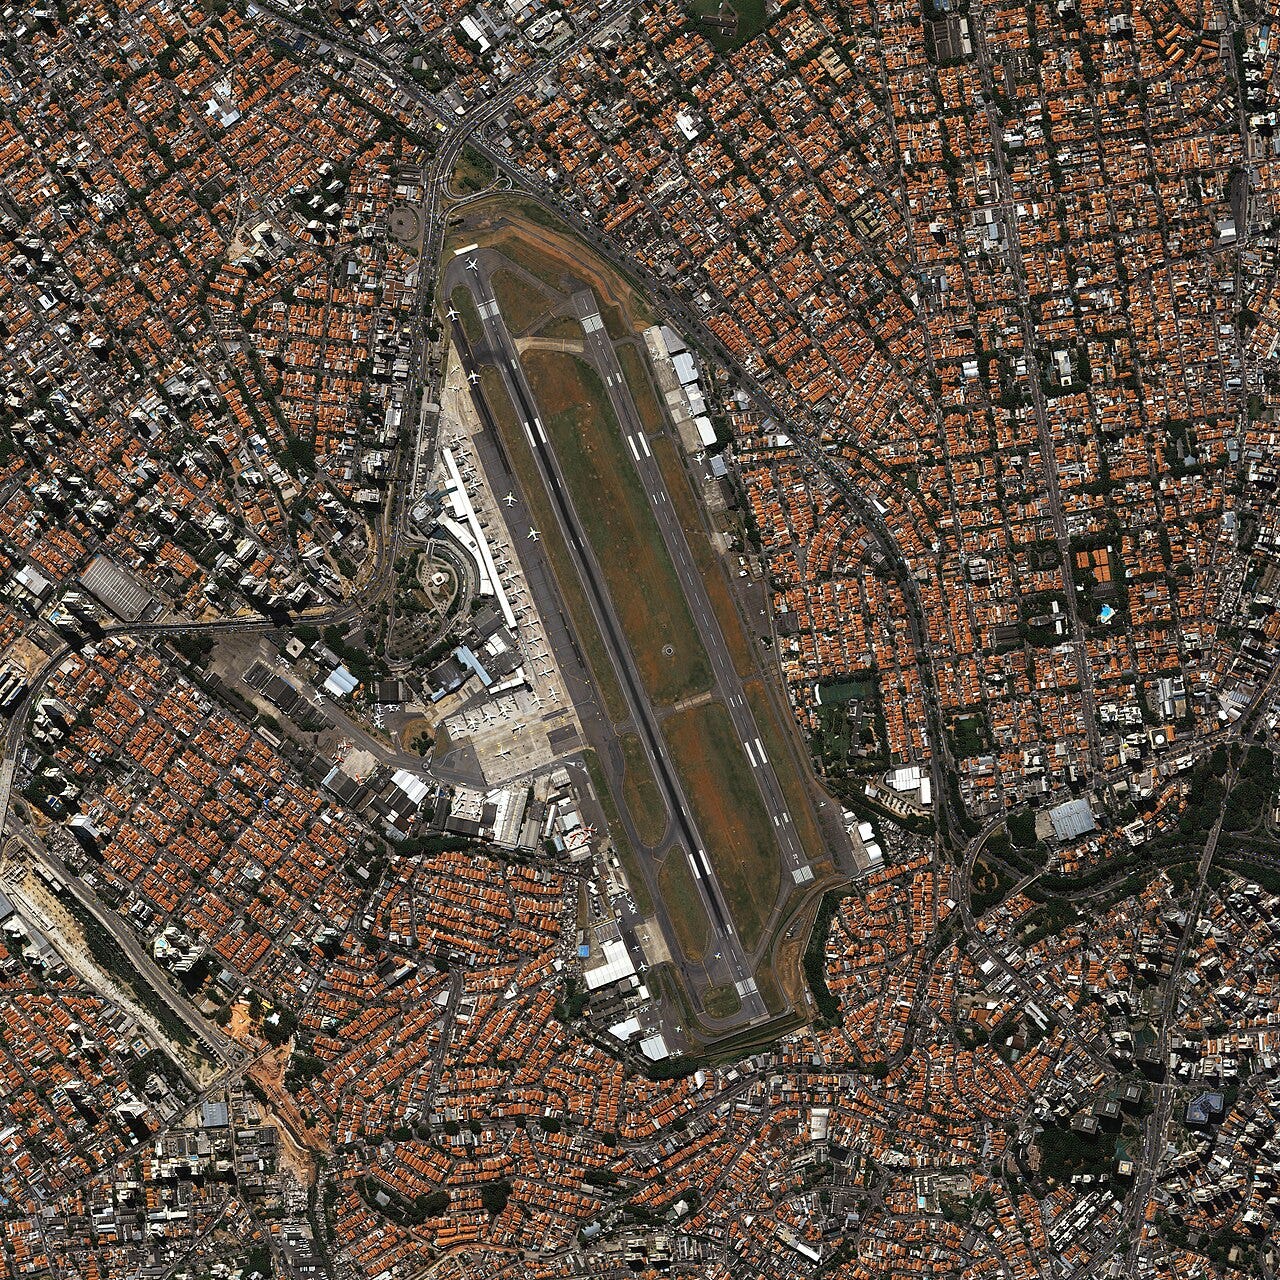
The aircraft descends over a dense residential grid, and for most of the final minutes there is no airport visible at all, only apartment towers. Then the runway appears, abruptly, between the buildings. Close enough that you can see into the windows of the apartments alongside it, close enough that people living there can presumably see you. Foreign visitors post about it constantly, usually with some variation of the observation that the plane seems to be landing in the middle of a neighborhood.
That is because it is. Congonhas is not an airport with a city that grew toward it. It is an airport that was surrounded, decades ago, and never moved. It handles over 20 million passengers a year from a footprint wedged into the urban fabric of a city of 12 million.
The visual is memorable enough that it tends to be the whole story people tell about the airport. But the more interesting thing about Congonhas is not where it sits. It is what flies out of it.
A distribution that does not look like the others
Downtown airports exist for a specific reason. They are close to the business district, they take short haul traffic, and the time saved getting to them justifies the operational compromises they impose. Sao Paulo has Congonhas. New York has LaGuardia. London has City. Buenos Aires has Aeroparque.
They are usually described as versions of the same idea. Looking at weekly flight frequencies, they are not.
Pulling route data from Flightradar24 in August 2026, the busiest route out of Congonhas is the shuttle to Rio de Janeiro’s Santos Dumont, at 368 flights per week. The second busiest, to Brasilia, runs 167. Then Porto Alegre and Belo Horizonte at 160 each, Curitiba at 138, Salvador at 95, Recife at 85, Florianopolis at 84, Goiania at 67.
The Rio shuttle carries more than twice the frequency of the next route on the list, and roughly as much as the second and third combined. That top heavy shape is what makes the airport unusual, and it is worth looking at what the comparable airports do instead.
LaGuardia is busier at the top but flatter overall

LaGuardia’s leading route is Chicago O’Hare at 227 flights per week, followed by Toronto at 162, Atlanta at 159, Boston at 154, Dallas Fort Worth at 125, Miami at 104, Charlotte at 101, Washington National at 94, Denver at 89, Nashville at 86.
The first place figure is large, but the drop to second is far gentler than Sao Paulo’s. More importantly, the list spreads across a continent. Chicago, Atlanta, Dallas, Denver and Miami are not a single business corridor. They are the hubs of an entire national network, and LaGuardia connects to all of them at similar intensity.
The tail is also thicker. LaGuardia’s tenth busiest route runs 86 flights per week. Congonhas’s ninth runs 67. The American airport sustains meaningful frequency much further down the list.
London City operates on a completely different scale
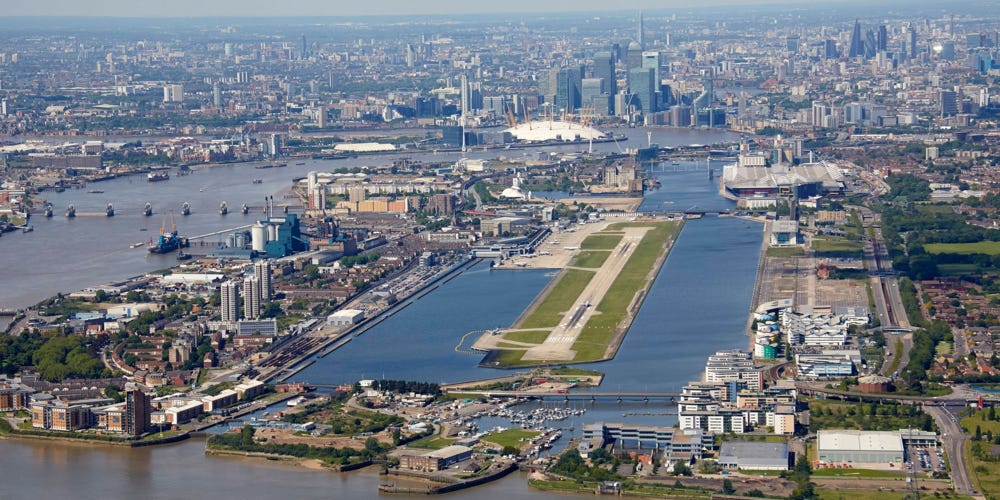
London City’s busiest route is Amsterdam at 57 flights per week, then Zurich at 37, Milan Linate at 31, Edinburgh at 30, Glasgow at 25, Luxembourg at 23, Nice at 22, Dublin at 21, Ibiza at 19, Berlin at 19.
The entire airport runs at a fraction of the frequency of the other two. Its busiest route would not crack the top five at Congonhas. What it does instead is serve a tight set of European financial and administrative centers, plus a couple of leisure destinations, at consistent low volume.
That is a different design entirely. London City is not a shuttle airport with a dominant corridor. It is a convenience airport for a specific professional population moving between a handful of cities, and its route list reads exactly like that.
Aeroparque mixes business and leisure in a way the others do not
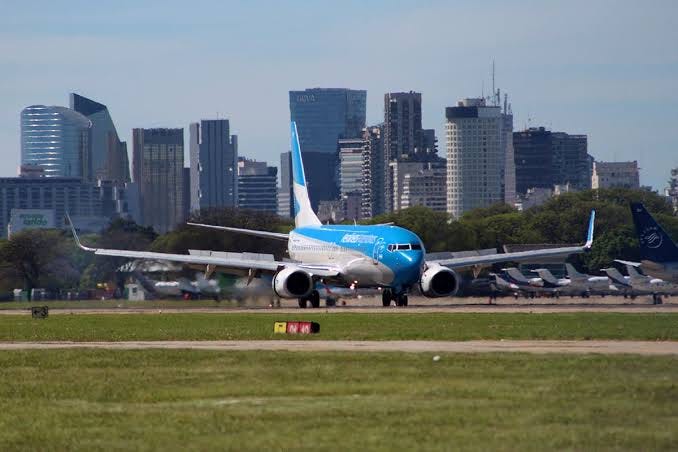
Buenos Aires Aeroparque leads with Bariloche at 102 flights per week, then Cordoba at 92, Mendoza at 87, Iguazu at 66, Sao Paulo Guarulhos at 56, Santiago at 51, Neuquen at 51, Salta at 47, Rio de Janeiro at 47, Tucuman at 41.
Bariloche and Iguazu are tourism destinations. So, substantially, is Mendoza. The Argentine downtown airport carries domestic leisure traffic at the top of its list in a way neither Congonhas nor LaGuardia does, and the distribution across its top ten is the flattest of the four.
That matters for the comparison, because it shows the route profile is not determined by the format. It is determined by what the country’s internal travel demand actually looks like.
Why the São Paulo concentration exists
Two things explain the shape of the Congonhas list.
The first is that Sao Paulo and Rio sit roughly 400 kilometers apart, which is the distance where flying beats driving for a same day business trip but does not require a wide body aircraft or a long block time. That is close to the ideal shuttle distance, and both cities have a downtown airport positioned to serve it.
The second is that Brazil’s corporate activity is more geographically concentrated than the American equivalent. LaGuardia connects New York to five or six comparably important business centers. Congonhas connects Sao Paulo to one dominant counterpart and then a set of considerably smaller ones. That is not an operational choice by any airline. It reflects where the country’s corporate demand actually sits.
Guarulhos, the larger Sao Paulo airport by volume, confirms this from the other direction. Its busiest route is Porto Alegre at 125 flights per week, then Santiago at 118, Recife at 104, Curitiba and Belo Horizonte at 96 each, Rio Galeao at 82, Salvador at 72, Brasilia and Fortaleza at 68 each. The distribution is flatter, international destinations appear immediately, and no single route dominates.
The two Sao Paulo airports are not a large one and a small version of it. They do structurally different jobs, and any analysis treating Sao Paulo as a single aviation market will miss that.
What concentration does to price
This structure has a direct commercial consequence, and it shows up in fares.
Comparing domestic tickets issued for Monday morning departures against the same routes Tuesday through Friday, in the same 6am to noon window, Monday averaged 2,095.22 reais against 1,314.73 reais. That is 59.4 percent more for the identical trip taken a day later, across 930 paired domestic routes and 11,874 Monday morning issuances between August 2025 and July 2026.
Demand concentration in time and demand concentration in geography compound each other. When a large share of a country’s corporate air travel wants the same corridor in the same few hours of the same day, the pricing response is sharp rather than gradual. An airport whose top route carries twice its second place has very little slack to absorb a demand spike.
I have written before about how the corporate travel market here is growing in price rather than in trips, and about how Brazilian airfare stayed expensive even when input costs moved in the country’s favor. Structural concentration belongs in that explanation alongside fuel and exchange rates, and it gets discussed far less.
What this says about reading global aviation data
None of this appears in a global corporate travel report, and the reason is instructive.
Aggregate aviation analysis tends to compare airports on passenger volume, on-time performance, or total destinations served. Those measures put Congonhas and LaGuardia in roughly the same category. The shape of the route distribution, which is where the actual difference lives, rarely gets compared at all.
Latin America keeps showing up in the data I work with at VOLL, the corporate travel and expense management platform I cofounded, as a region whose structure diverges from the global average rather than tracking it. This is a small example, but a clean one. Four airports built for the same purpose, and four different answers to the question of what that purpose actually requires.
A company managing travel out of Sao Paulo is operating in a market with a single dominant corridor and very little structural slack. A company managing travel out of New York is not. Those are different planning problems, and running the same playbook for both is how a travel budget gets surprised.
The runway between the apartment buildings is the part visitors remember. The route list is the part that shows up on the invoice.
About me

I am an entrepreneur with over 20 years of experience at the intersection of tourism and technology. I am co-founder and Chief Business Officer of VOLL, the largest mobile-first corporate travel and expense management platform in Latin America, and a recognized reference in the development of the corporate travel industry.
A Marketing specialist from Fundação Dom Cabral, I serve on the Tourism Council of FecomércioSP and on the Executive Council of the Latin American Association of Corporate Events and Travel Management (Alagev). A frequent traveler and close observer of human behavior in motion, I write and speak about innovation, digital transformation, entrepreneurial leadership, and the future of corporate travel.