



The most useful thing anyone said on the opening main stage in Chicago came from a man whose company sells the seats.
Scott Kirby, the chief executive of United Airlines, sat for a conversation about the industry outlook and made a point that cut against the celebratory mood of a convention week. Demand right now is strong, he said, but corporate travel has not fully returned to where it was before the pandemic. There are still fewer business trips than there used to be.
He added a second idea I have not stopped thinking about since. Airlines, in his telling, are one of the best real-time economic indicators there is, because travel is the first thing a company cuts when conditions tighten and the first thing it restores when they improve.
I have been writing a version of that first sentence for months, and it is a considerably easier argument to make when the person making it runs one of the largest airlines in the world.
Then GBTA put the data on the screen, and the sentence stopped being an opinion.
The two numbers that matter
Here they are, and everything in this piece follows from the distance between them.
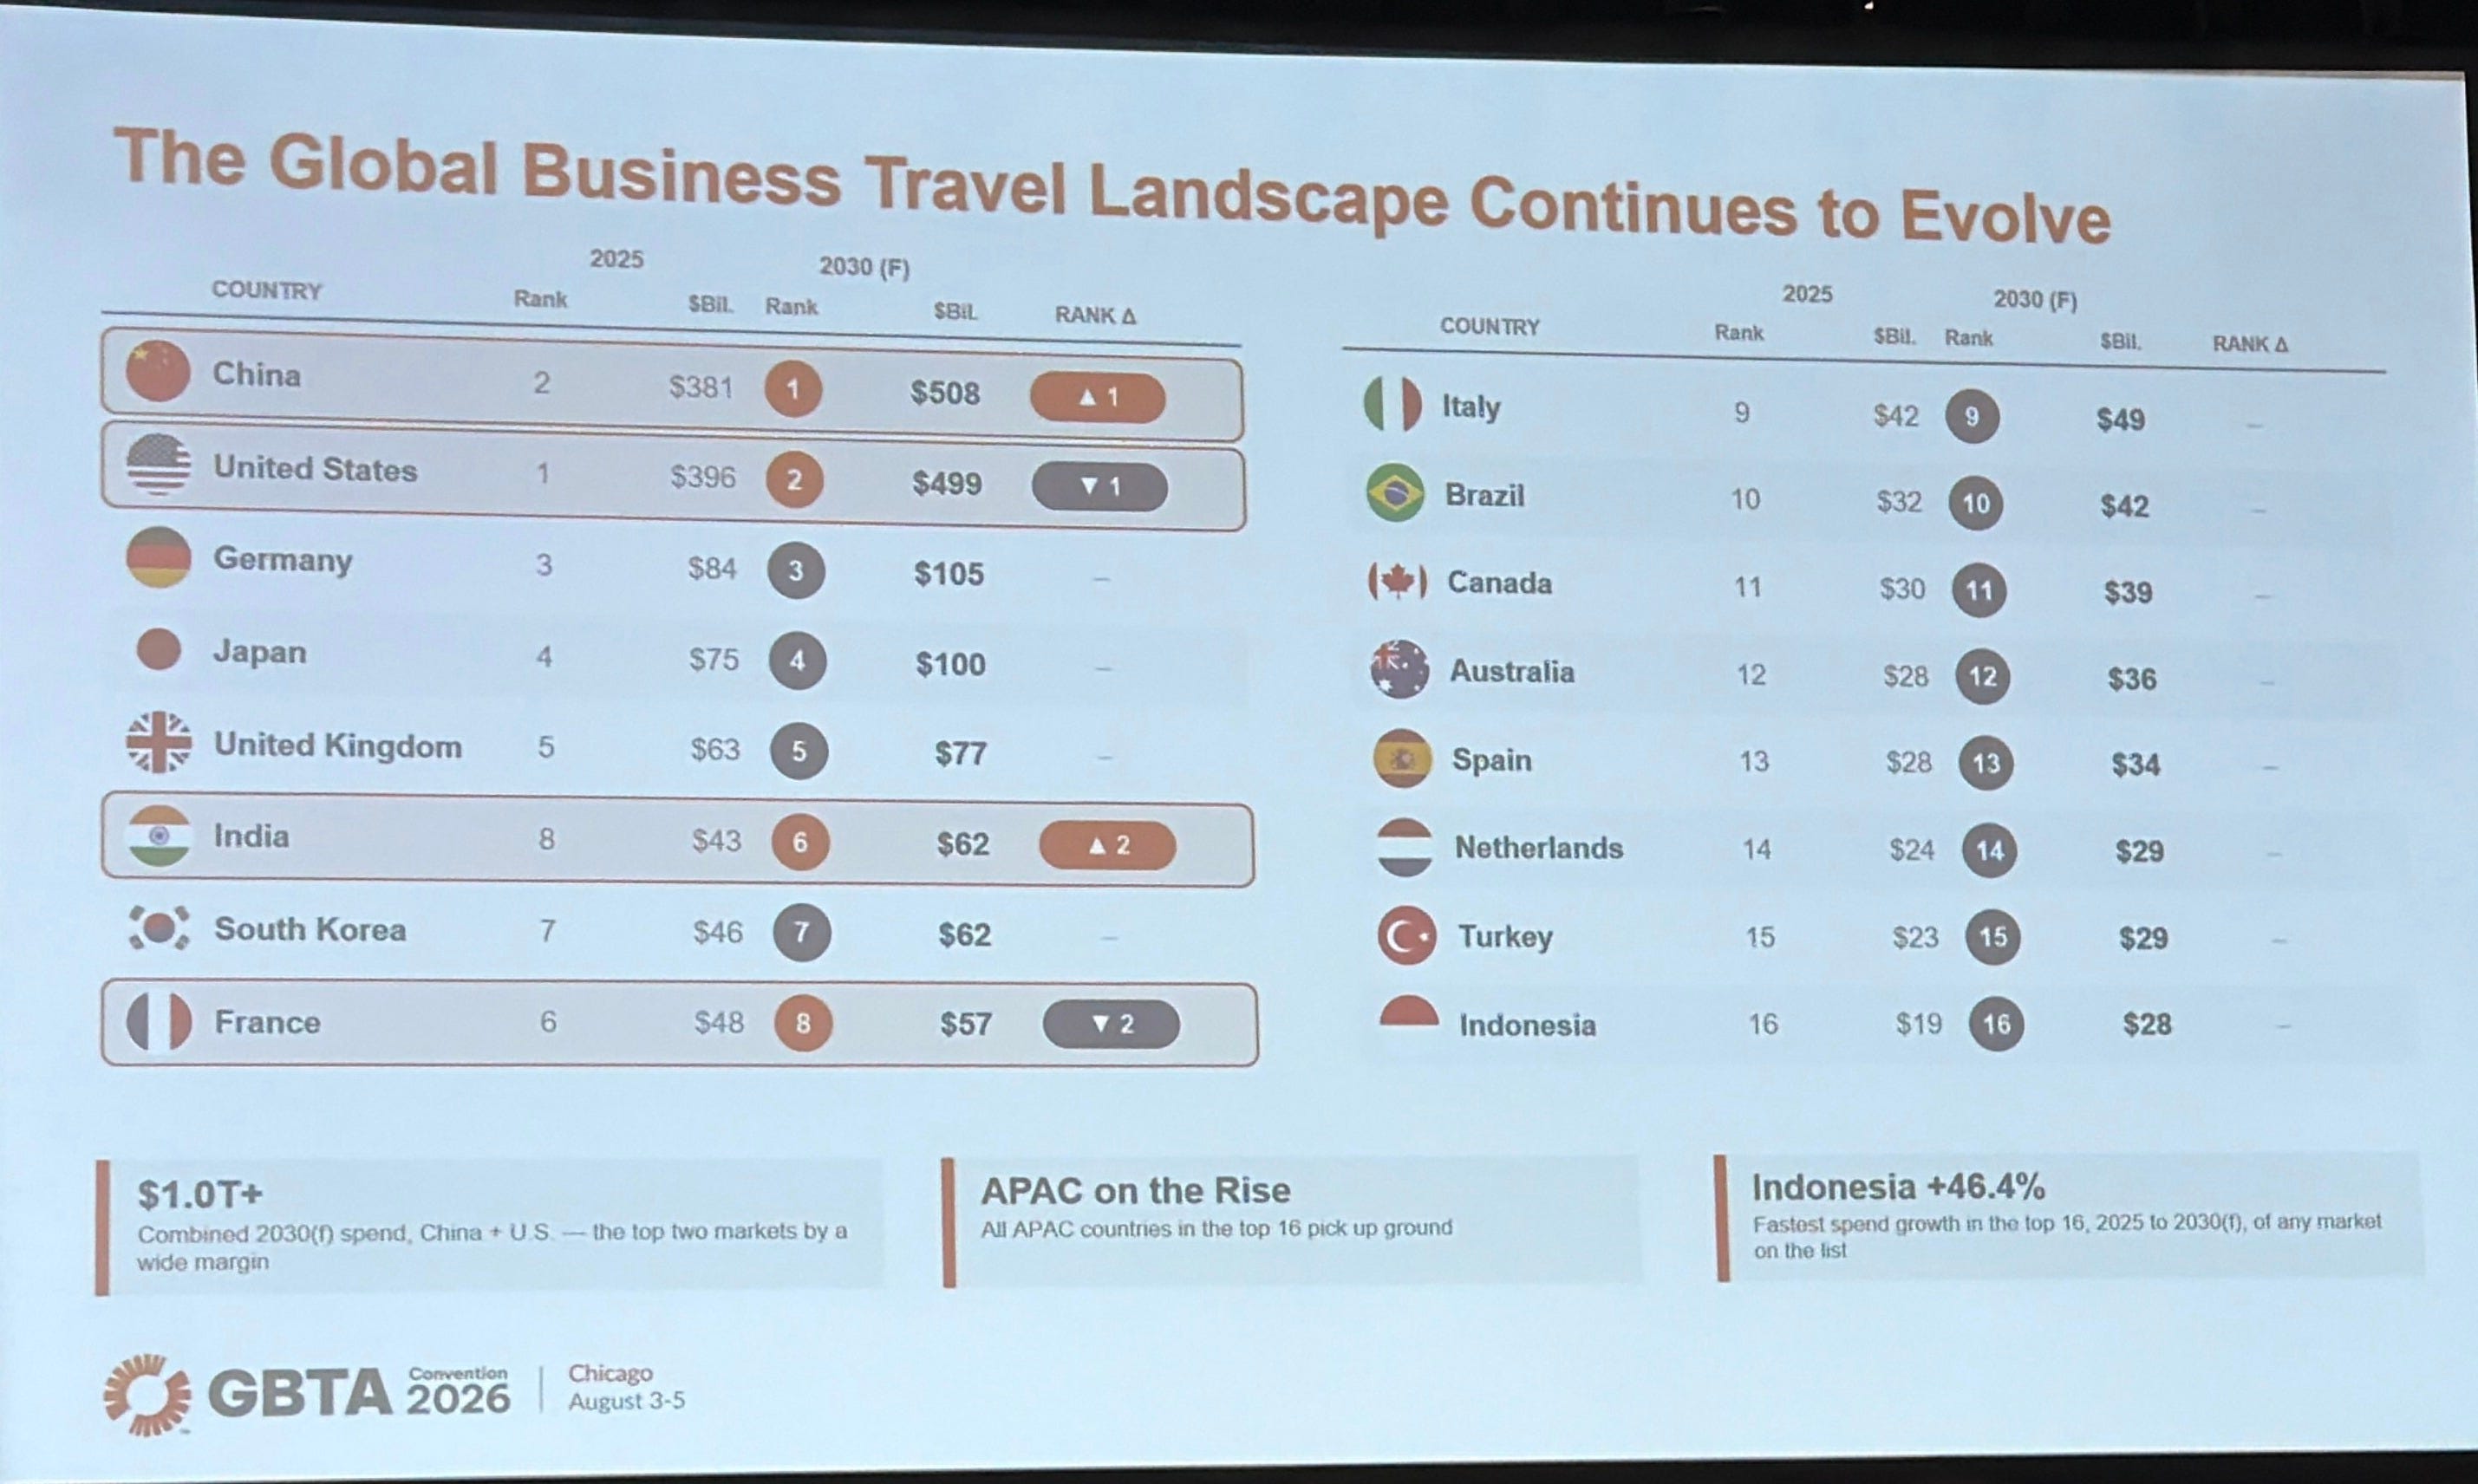
Global business travel spending is projected to reach 1.71 trillion dollars in 2026, an increase of 7.2%. That is a nominal record. It is the number that made every trade headline this week, and it is genuinely good news for anyone selling into this industry.
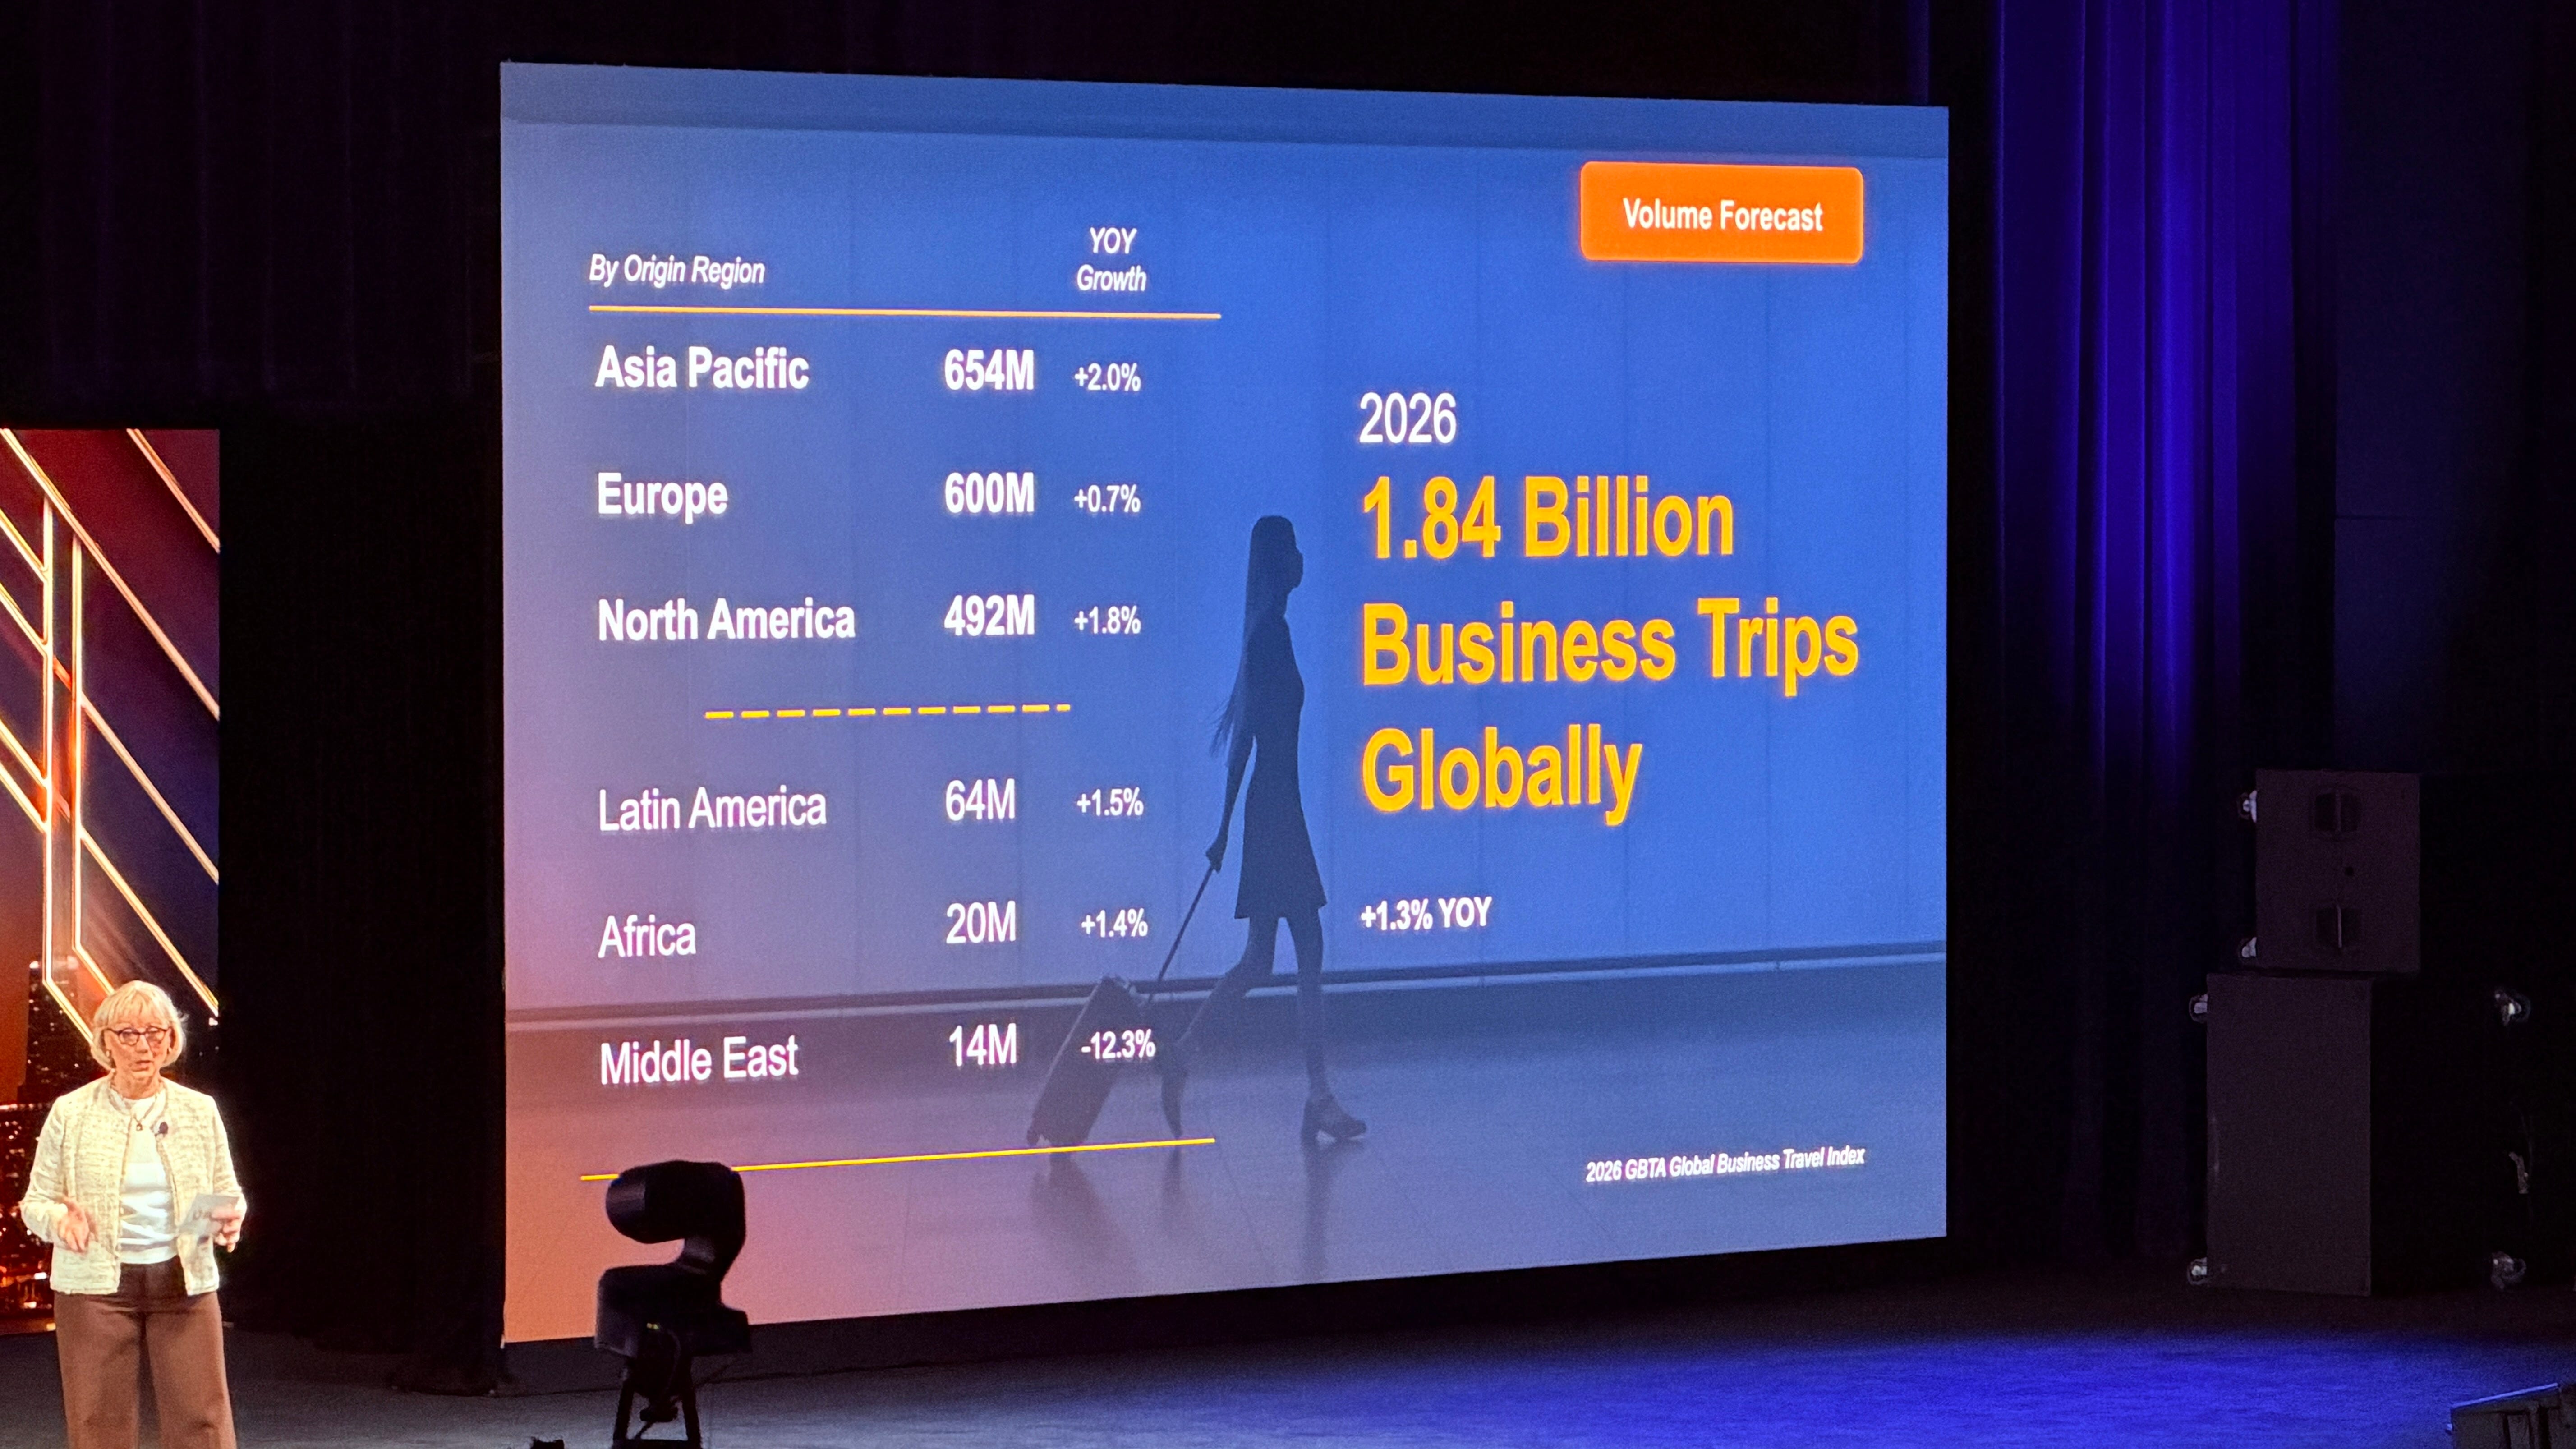
The number of business trips taken worldwide in 2026 is projected at 1.84 billion, an increase of 1.3%. Up from roughly 1.82 billion last year.
Sit with that for a second. The money is growing more than five times faster than the travel.
Something is expanding this market, and it is not people getting on more planes.
Why the volume number is new, and why that matters
This is the eighteenth edition of the Business Travel Index, and it is the first one to publish a worldwide volume forecast alongside the spending forecast.
That detail is easy to skip past and it is the most important methodological development in this report in years. For seventeen editions, the industry’s most comprehensive measurement of itself described how much money moved. It did not describe how much travel happened. Everyone assumed the two moved together, because in most years they roughly did, and because nobody had a global figure to check the assumption against.
Now there is one, and the assumption does not hold. A market can post a nominal record and a nearly flat activity year at the same time, and until this edition, the industry had no clean way of seeing that.
I want to give credit where it is due here. Publishing a volume series that immediately complicates your own headline is not the obvious commercial choice for a trade association. It is the correct analytical one.
Now adjust for inflation, and the picture inverts
If the volume number complicates the story, the inflation adjustment rewrites it.
Measured in constant dollars, global business travel spending in 2026 sits roughly 8.4% below the 2019 peak. The report does not expect real spending to return to its pre-pandemic level until 2030.
Read that against the nominal series and the whole recovery narrative of the last four years looks different. The industry crossed its old record in 2024 and has been celebrating ever since. In purchasing power, it has not crossed anything. We are spending more money to buy less travel than we bought in 2019, and we have been describing that as a recovery.
This is the point where I part company with a lot of the commentary I read this week. The nominal record is real. The growth is real. But a market that is up in dollars and flat in trips and down in real terms is not recovering. It is repricing.
There is one more piece of arithmetic worth putting next to it. Spending is projected to pass two trillion dollars in 2030, which is one year later than the same report projected a year ago. The milestone keeps moving out. That is what deceleration looks like when you plot it: 8.4% growth in 2025, 7.2% in 2026, then a steady descent toward the mid single digits.
A trap in the numbers, and why I am flagging it
Before anyone builds an argument on average spend per trip, a warning that comes directly from the methodology.
This year’s report changed what counts as a trip. The 2026 edition includes day trips. The previous edition counted overnight travel only. Which means the average spend per trip figures from the two editions are not comparable, and the apparent drop between them is a definitional artifact, not a market movement.
I am flagging it because I expect to see that false comparison in circulation within a week, probably in a vendor deck, presented as evidence that companies are cutting back per trip. They may well be. This data does not show it.
The same caution applies to year-over-year revisions elsewhere in the series. Brazil’s 2025 spending, for example, was revised upward from the prior edition. Revisions are normal in modeled series and they are not scandals, but anyone quoting a number from last year’s report next to a number from this year’s should say which is which.
What this does to the ROI conversation
Here is where the volume and price split stops being an analyst’s curiosity and starts landing on somebody’s desk.
I have argued before that the travel function is asked to prove a return using an information set that only contains half the equation: it holds the cost data completely and the outcome data almost never. That structural problem does not change this year. What changes is the pressure on it.
When trip volume is flat and spending is up 7.2%, every trip in the portfolio costs more and there are no additional trips to show for it. From a finance seat, that reads as a line item growing without a corresponding increase in activity, which is exactly the pattern that triggers a review.
And the travel manager walking into that review has the same tools they had last year. Cost per trip, which is a ratio of input to input. Compliance rate, which measures process. Savings against a benchmark, which measures negotiation. None of these answer the question finance is actually asking, which is whether the company got more back than it put in.
So the honest version of this year’s forecast, translated into a sentence a travel leader can use internally, is this: the budget conversation just got harder for reasons that have nothing to do with how well the program is being run. Fuel prices, airfare inflation and currency did this. The program did not.
That distinction is worth defending explicitly, and early, before somebody else frames the same numbers as a performance problem.

The market is getting more managed, which cuts both ways
One of the quieter findings in this year’s report is that corporate control over travel is tightening.
Roughly 65% of companies now require or encourage the use of a travel management company or a corporate booking tool, up about six percentage points from the prior edition. Around 62% of bookings now go through a corporate channel.
The optimistic reading is that visibility is improving, which it is, and that more spend is falling under policy, which it also is.
The less comfortable reading is that a good part of this year’s measured spending growth may be a measurement effect rather than a market effect. When travel that was already happening moves from a personal card into a managed channel, no new trip is created, but a great deal of previously invisible spending becomes visible. Some portion of that 7.2% is almost certainly conversion rather than expansion.
I do not know how large that portion is, and I do not think anyone does with precision. But it is one of the few readings that reconciles a nearly flat volume line with a strongly growing spend line, and it deserves more attention than it is getting.
Latin America is the extreme version of this
Every pattern in this report is sharper in the region I work from.
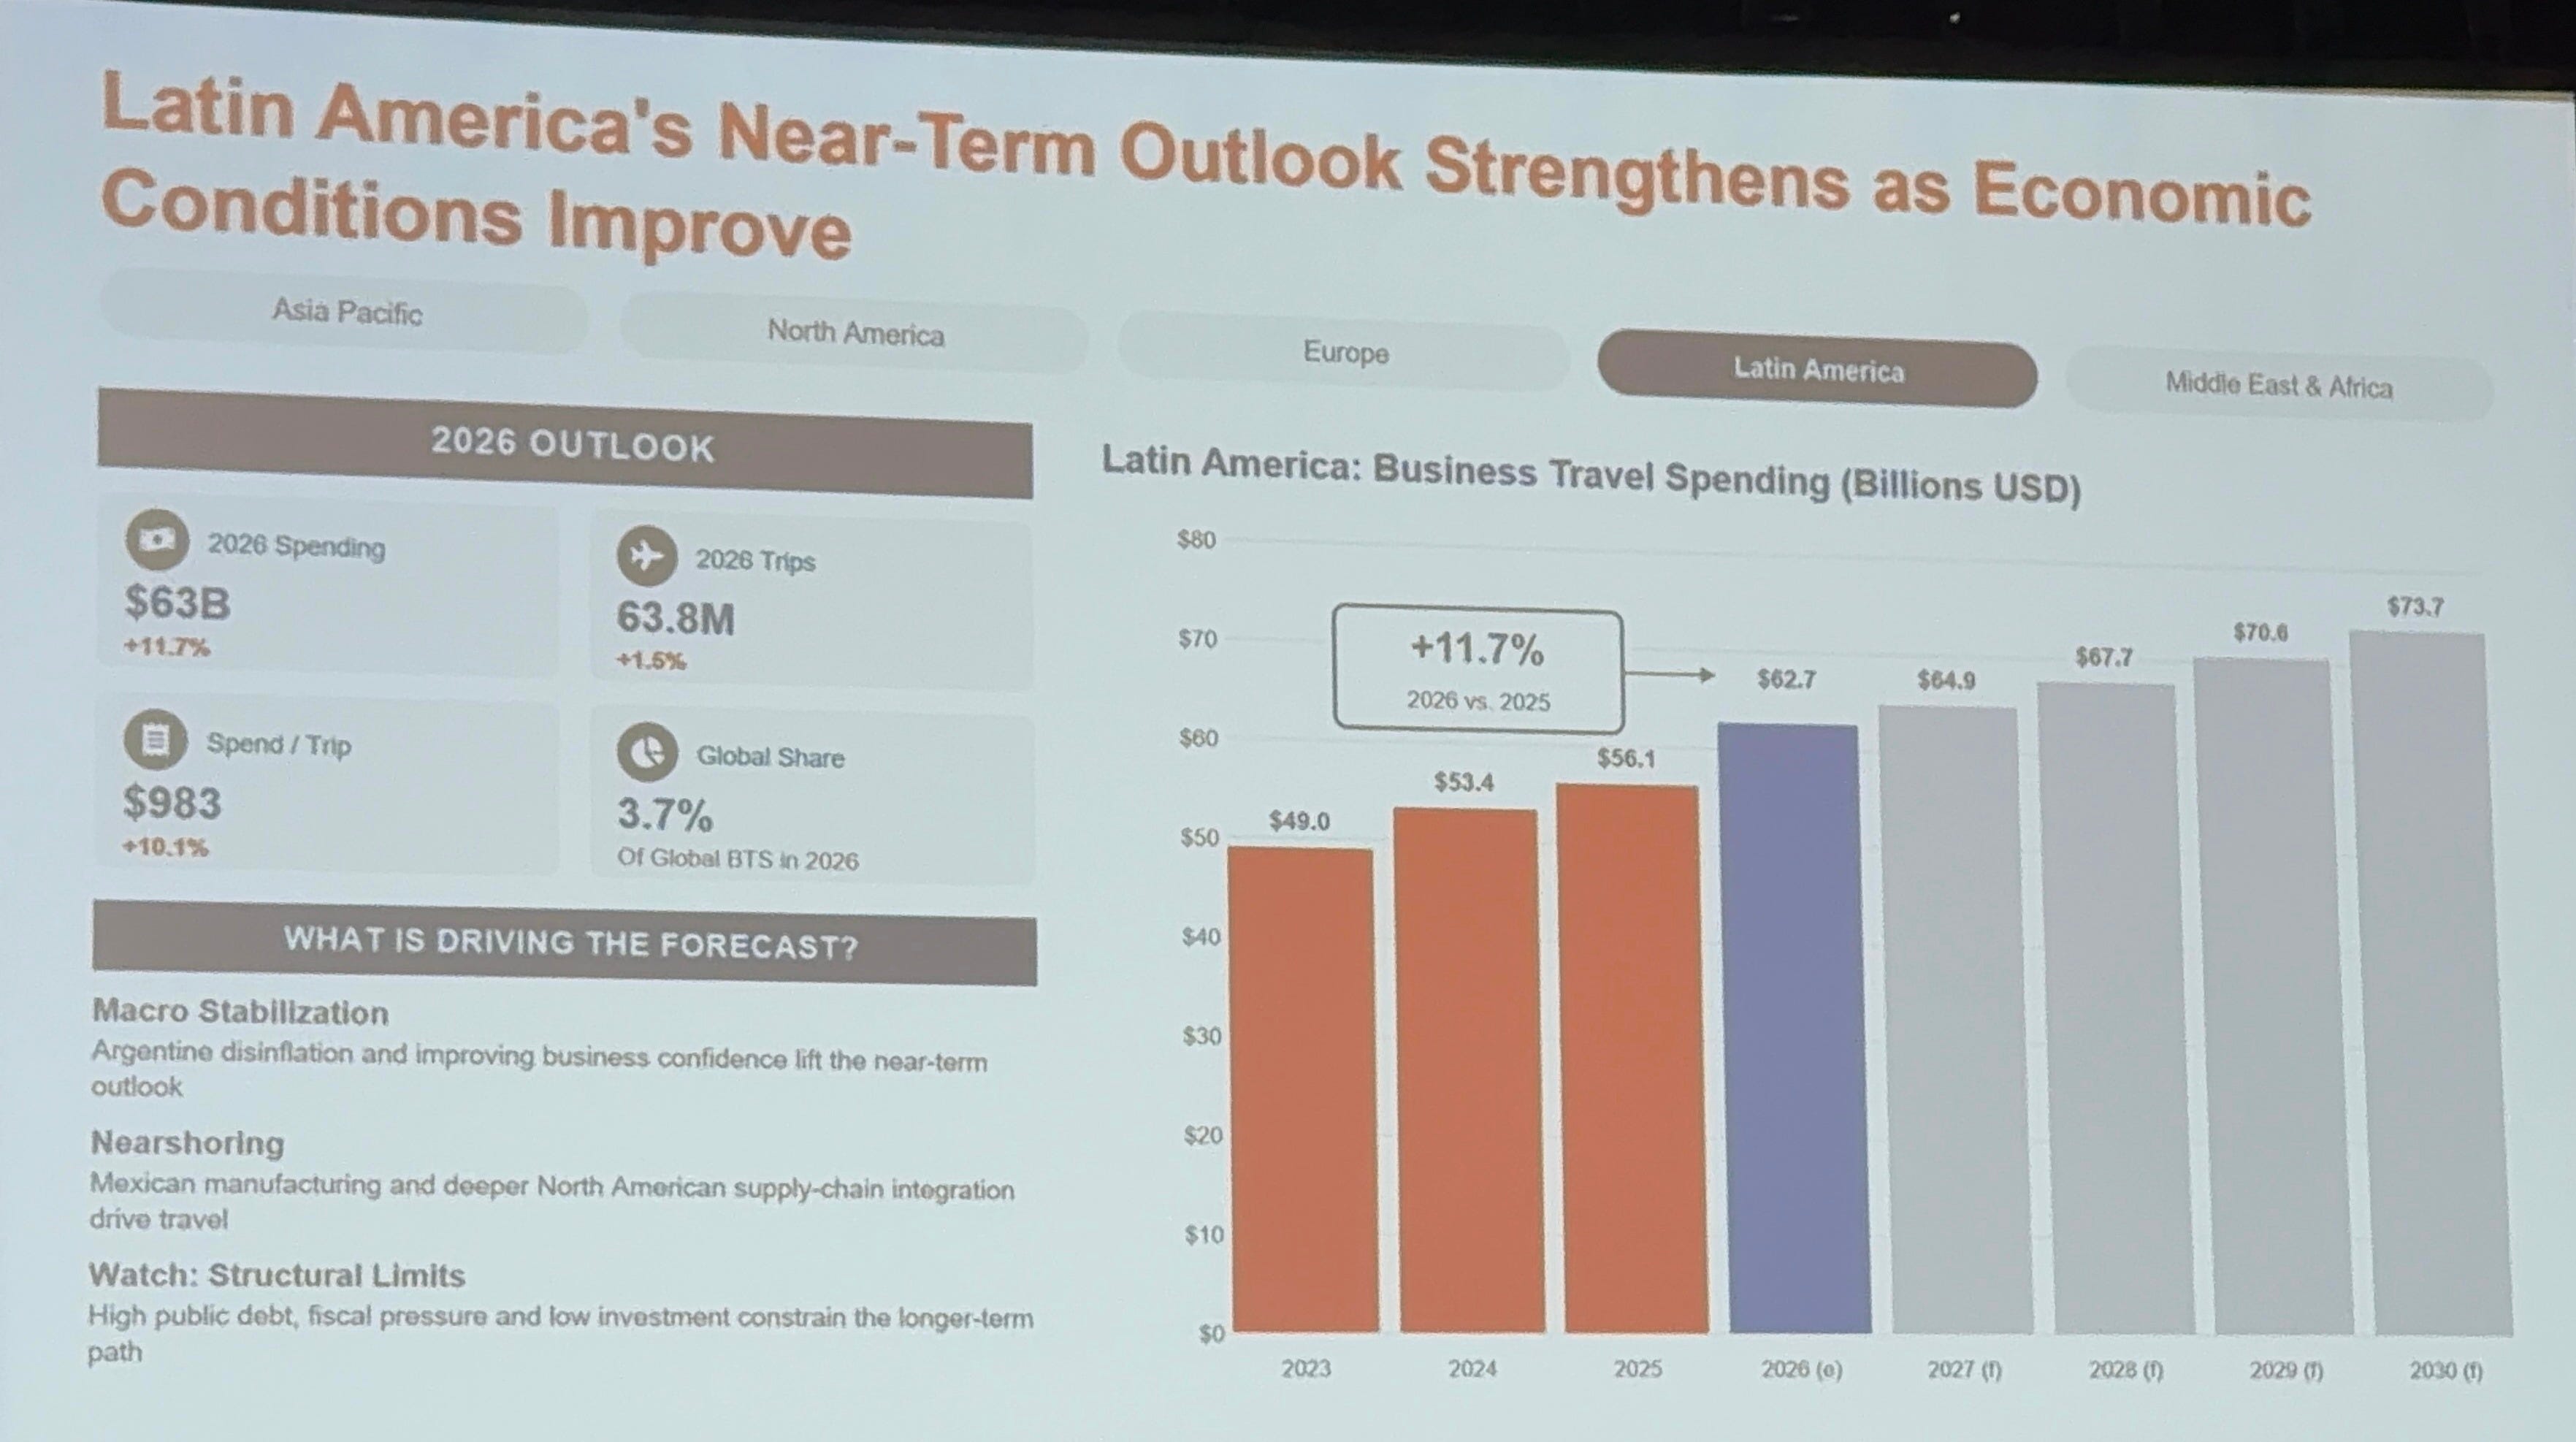
Latin American business travel spending grows 11.7% this year, faster than any larger region measured. Latin American trip volume grows 1.5%.
In global terms, money is growing about five times faster than travel. In this region, it is growing nearly eight times faster.
Part of that is airfare. Air travel accounts for a larger share of the cost of a business trip in Latin America than almost anywhere: around 327 dollars of an average 892 dollar trip, which is roughly 37% of the total, against about 32% globally. Lodging, meanwhile, is the lowest in the world at around 122 dollars. And rail use in the region sits at 25%, the lowest of any region measured.
That combination is structural, and it explains why this region absorbs a fuel shock harder than any other. When the single largest component of your trip cost is the one most exposed to jet fuel, and there is no meaningful ground alternative for the distances involved, an energy market shock does not get diluted on the way to your travel budget. It arrives at full strength.
Brazil sits inside that picture as the fastest growing of the fifteen largest markets, at a projected 13.8%, with 35.8 billion dollars in spending and tenth position globally. That is a market growing quickly, in a region whose costs are unusually exposed, with a cost structure that concentrates risk in exactly the category doing the most to inflate the global numbers.
I would add one caution to my own argument here, because I would rather raise it than have someone raise it for me. Brazil’s compound growth rate projected out to 2030 is considerably more modest than this year’s headline figure. This is an acceleration year, not a new structural plateau, and anyone treating 13.8% as the region’s new normal is reading one data point as a trend.
What I would actually do with this
If I ran a travel program right now, three things would change on my desk this month.
I would rebase the budget on price, not on volume. A budget built on last year’s fare and rate assumptions will undershoot, and it will undershoot even if nobody in the company takes a single additional trip. That is a very different conversation to have in advance than in arrears.
I would separate price effects from program effects in my reporting, explicitly and visibly. If total spend is up 12% and fares in my market are up 11%, that is one story. If total spend is up 12% and fares are up 3%, that is a completely different story. Most travel reporting today does not make that distinction legible, and the person reading the report will assume the worst interpretation by default.
And I would stop reporting cost per trip as a headline metric. In a year when volume is flat and prices are rising, cost per trip will get worse no matter what the program does, and it will get worse fastest in exactly the categories where travel matters most. Reporting a number that is guaranteed to deteriorate for reasons outside your control is not transparency. It is handing someone else the frame.
Back to the stage
So the chief executive of an airline stood on a stage in Chicago and told a room full of buyers that this industry has not really come back yet, in the year of its largest nominal number ever.
I keep thinking about how strange that would sound to anyone reading only the headlines from this week. Record spending. Record forecast. Two trillion in sight. And underneath all of it, a volume line that has barely moved, a real spending figure still below where it stood seven years ago, and a milestone that keeps sliding a year further into the future.
None of that makes this a bad market. It makes it a different one than the headlines describe. The growth is in the price, and the price is not the same thing as the business.
That distinction is going to matter enormously to whoever has to defend a travel budget in the next six months. It might as well come from the people who understand where the number actually came from.
About me

I am an entrepreneur with over 20 years of experience at the intersection of tourism and technology. I am co-founder and Chief Business Officer of VOLL, the largest mobile-first corporate travel and expense management platform in Latin America, and a recognized reference in the development of the corporate travel industry.
A Marketing specialist from Fundação Dom Cabral, I serve on the Tourism Council of FecomércioSP and on the Executive Council of the Latin American Association of Corporate Events and Travel Management (Alagev). A frequent traveler and close observer of human behavior in motion, I write and speak about innovation, digital transformation, entrepreneurial leadership, and the future of corporate travel.