



The footnote that costs more than it looks
Every serious piece of global corporate travel research contains a version of the same sentence, usually near the methodology section, usually in smaller type. It says the sample is concentrated in North America and Western Europe, and that findings should be treated with caution elsewhere.
I have come to appreciate that footnote. It is honest, and the industry would be worse off without it. The problem is not that researchers hide the limitation. The problem is what happens after publication, when the finding travels and the footnote does not.
A number measured among 269 buyers in the United States, Canada and Europe becomes “the industry says.” A behavior observed in a US sample becomes “how business travelers behave.”
Somewhere in that translation, a region containing the world’s tenth largest corporate travel market simply stops existing as a variable.
I want to do the opposite exercise here. This is what the Brazilian corporate travel market looks like when you measure it from inside, using five independent sources, three of them producing data that no global report has ever seen.
Two disclosures first, since several of these sources are close to me. I cofounded VOLL, a corporate travel and expense management platform, and some of the transactional data below comes from our own base. I also sit on the board of Alagev, the regional association that co-produces one of the other datasets. Read accordingly.
Source one: the size of the market, measured monthly

Most countries do not know what they spend on business travel. Brazil does, because someone decided to count it every month.
Alagev, founded in 2003, produces a monthly survey with FecomercioSP measuring actual corporate spend across airfare, lodging, vehicle rental and ground transport. Not sentiment, not projection. Reported spend.
The series closed 2025 at 147.8 billion reais, the largest figure recorded in the sector’s history, up 6.3 percent on the previous year. January 2026 came in at 12 billion reais, a record for what is normally the quietest month of the year. March reached 18.2 billion, and by the end of May the year had accumulated close to 85 billion reais, running 6.2 percent ahead of 2025.
A market that measures itself monthly is a market that can be argued with. That sounds like a small thing. It is the difference between a region that appears in global rankings as an estimate and one that appears as a number somebody produced on purpose.
Source two: where Brazil sits globally
The second source measures the same market from outside, and produces a different number.
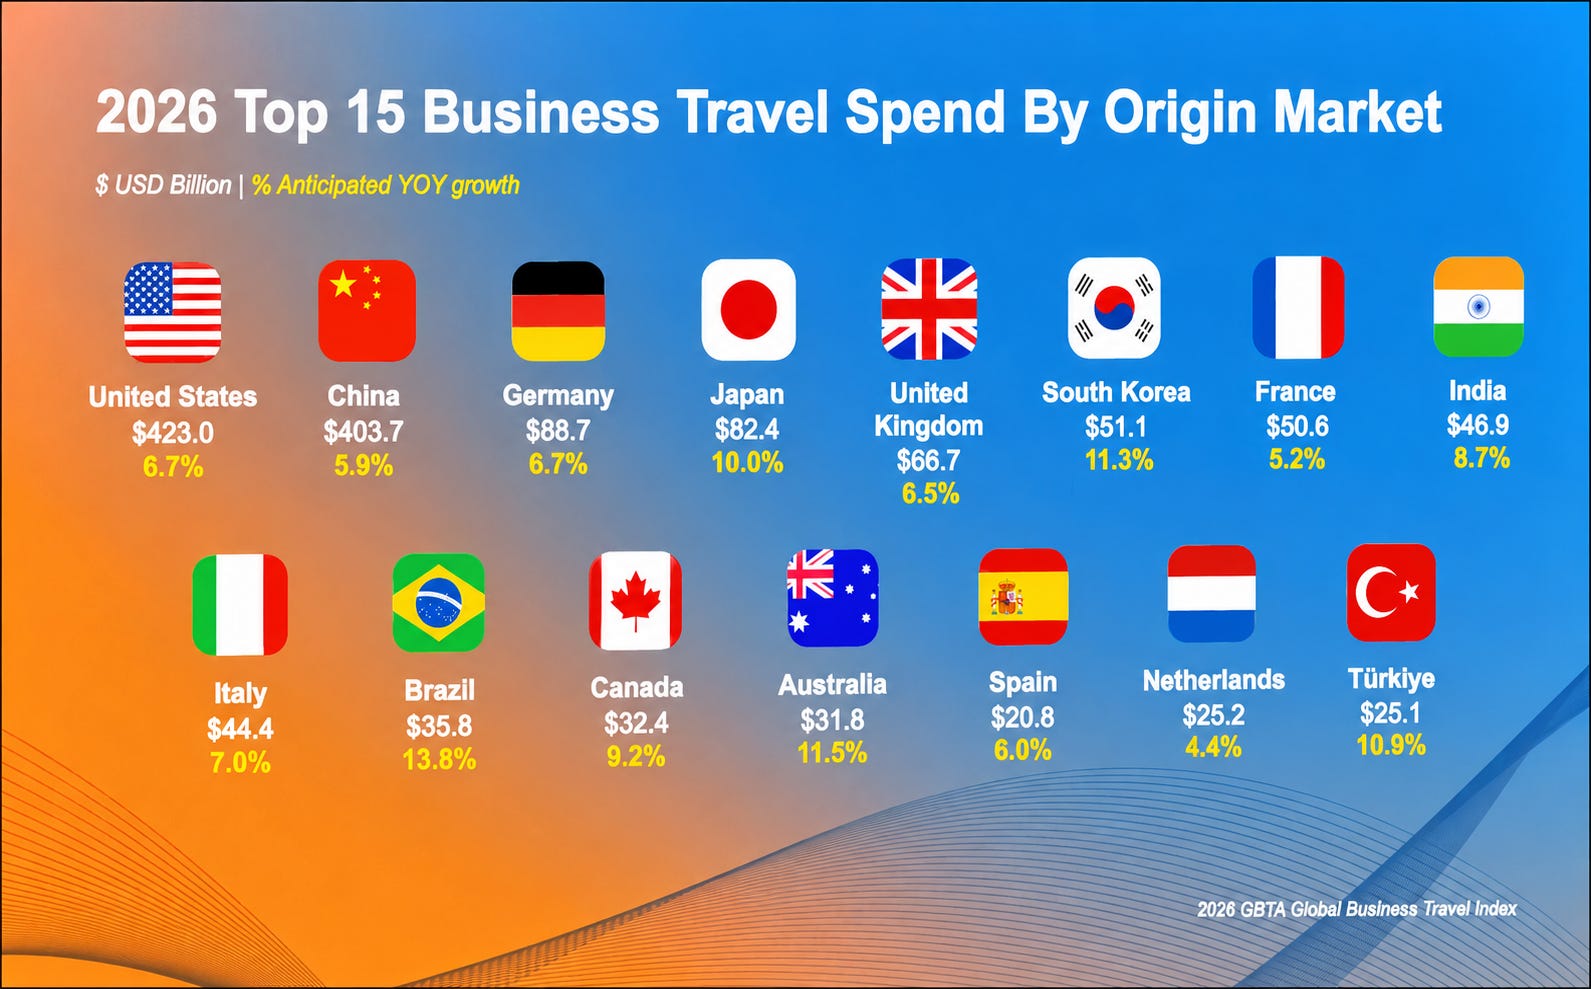
The GBTA’s Business Travel Index projected Brazil at 35.8 billion dollars for 2026, placing it among the world’s ten largest corporate travel markets, with projected growth of 13.8 percent. That was the fastest growth among the fifteen largest markets globally, ahead of Japan at 10 percent and both the United States and Germany at 6.7 percent.
Those two figures do not reconcile, and they are not supposed to. Different scope, different currency, different definition of what counts as corporate travel spend. The useful move is not to pick the larger one. The monthly series tells you the shape of the market from inside. The index tells you where it sits relative to everyone else.
Until recently Brazil had reliable access to neither.
Source three: what the transactions actually show
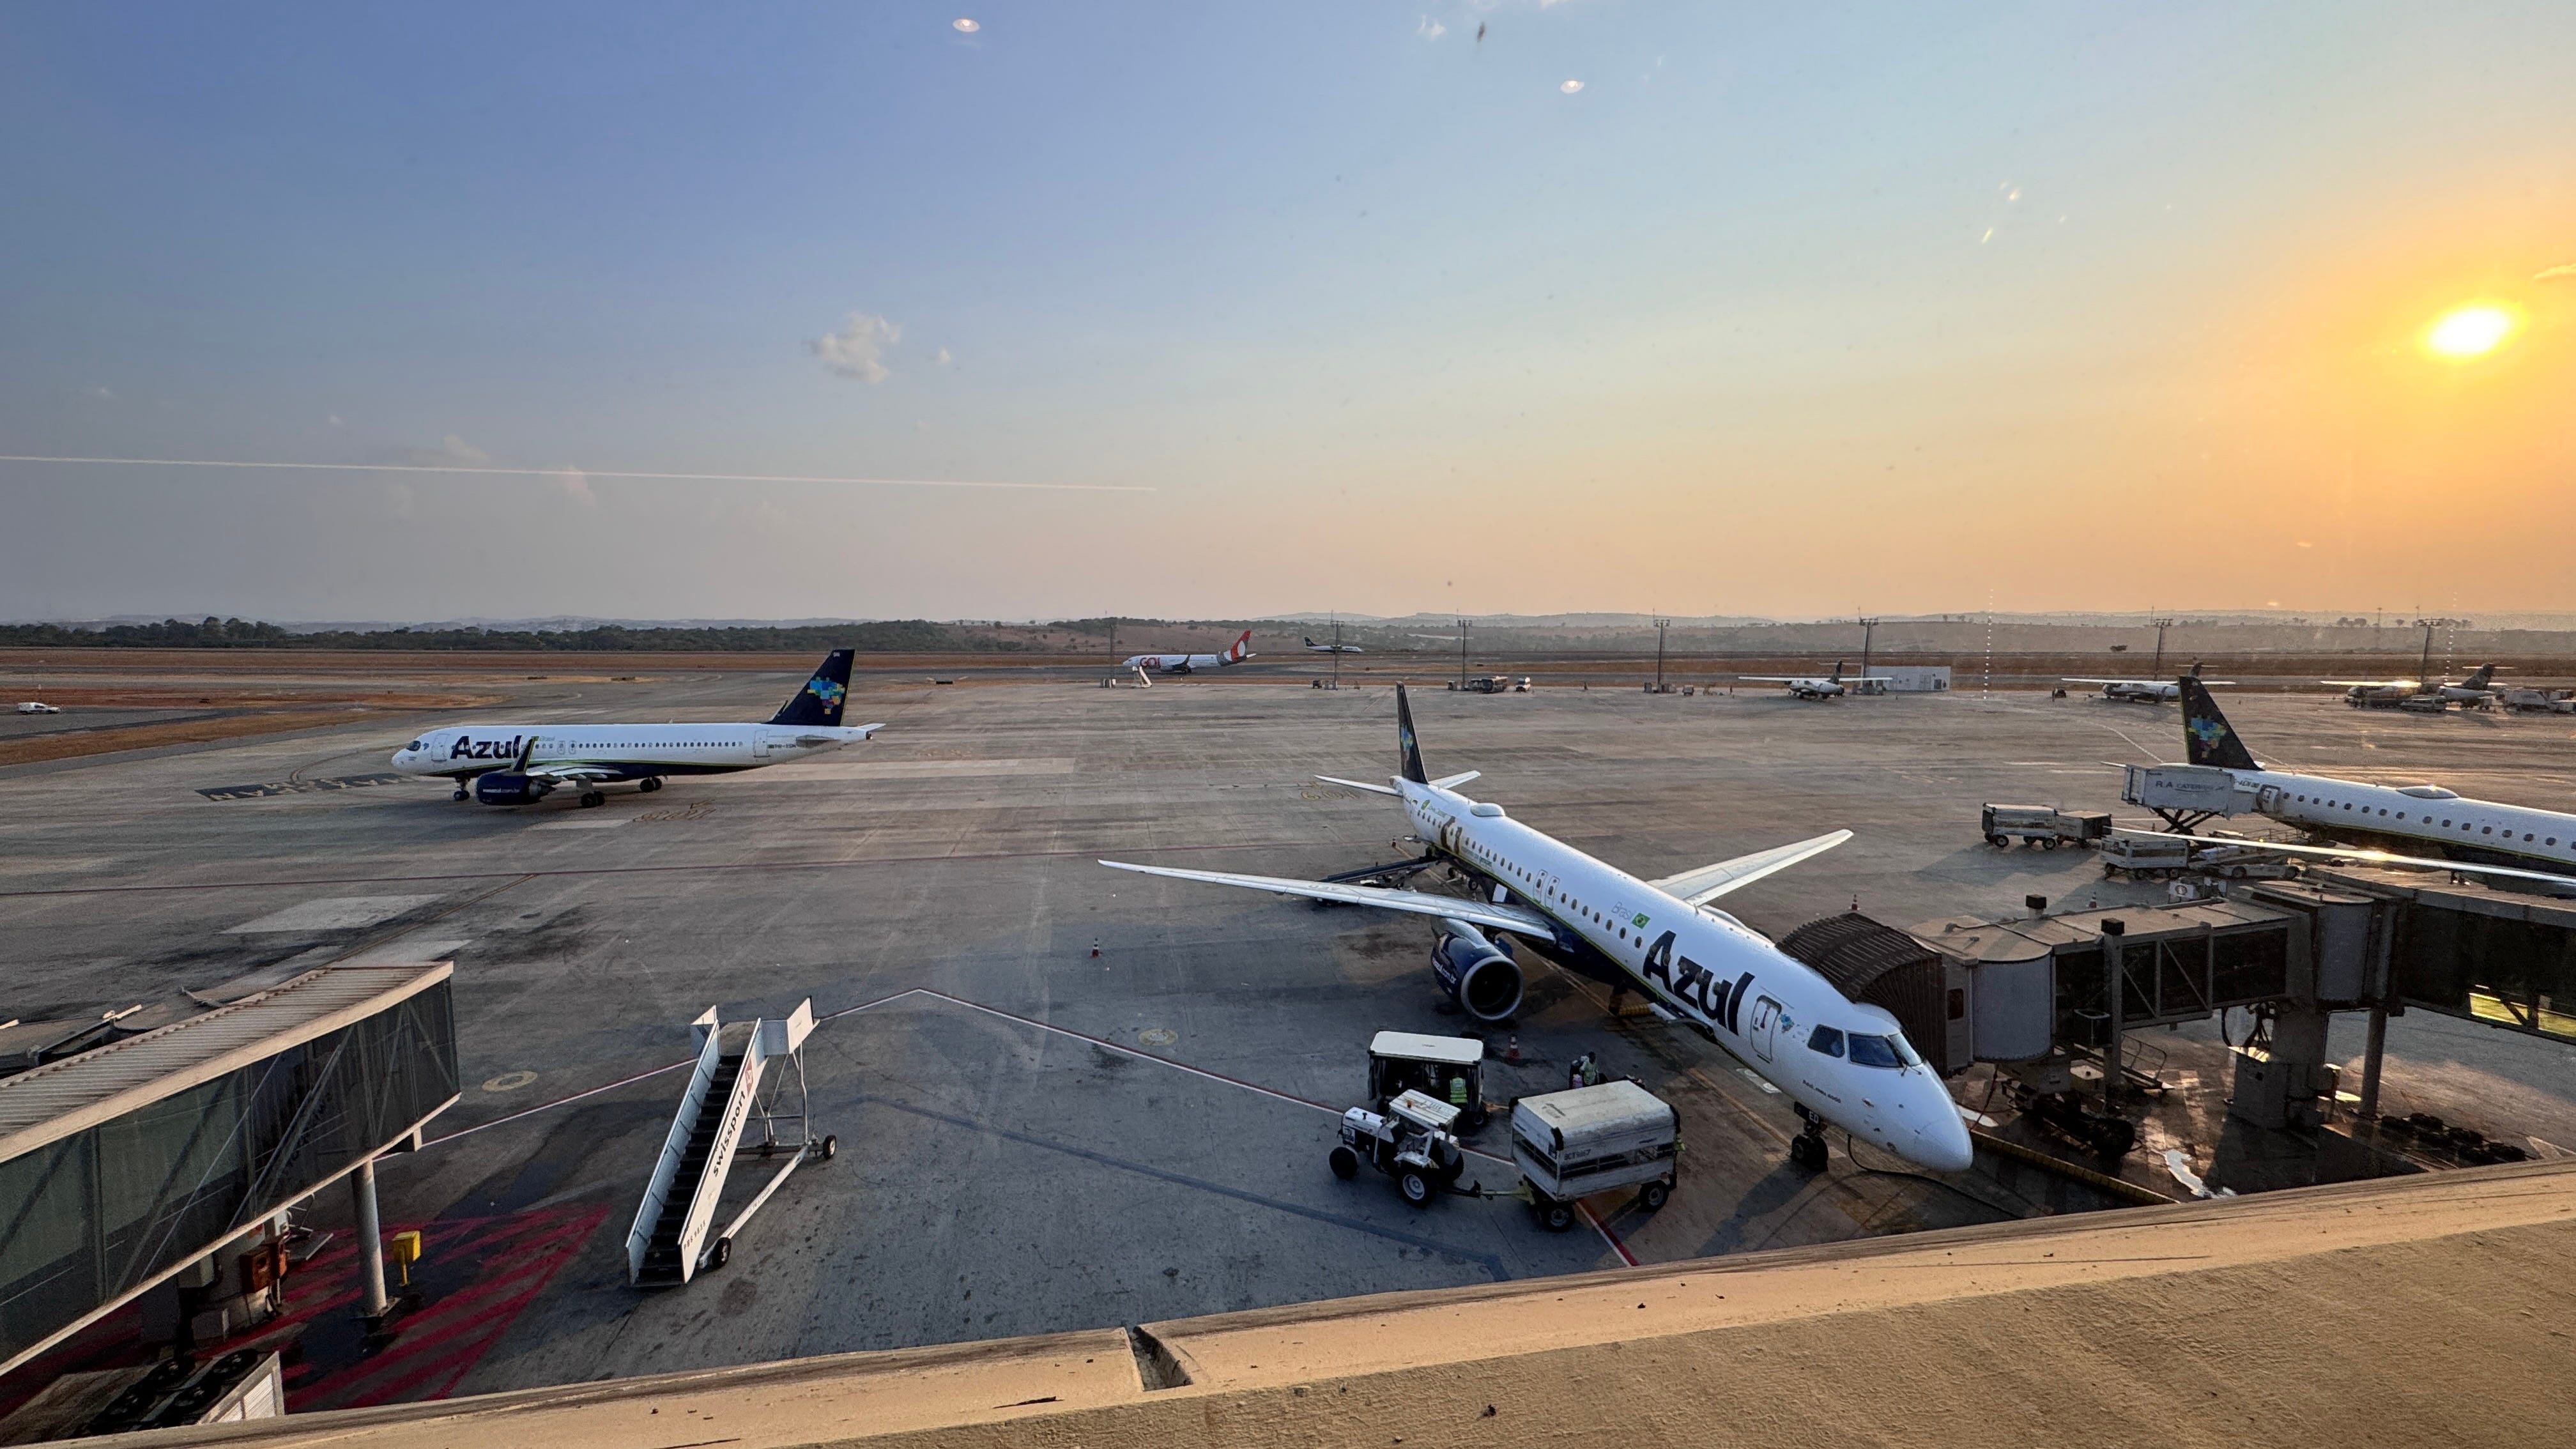
The third source is the one global research has no route to at all, because it is not survey data. It is what people actually paid.
Across more than 850,000 monthly users on our platform, 64.6 percent of transactions on the corporate prepaid card are now instant payment via Pix. Credit accounts for the remaining 35.4 percent.
No company mandated that shift. No change management program preceded it. Business travelers paid the way they already pay in their personal lives, and corporate payment followed them rather than the other way around, which is an unusual direction of travel for a payment behavior.
The timing follows the clock of a meal rather than the clock of a workday. Close to 60 percent of everything paid happens between the lunch hour and the dinner hour, and the most frequent merchant category is restaurants, followed by gas stations.
Sit with what that means for a moment. A global model calibrated on credit card behavior, monthly statements and printed receipts will get the Brazilian volume wrong, the transaction size wrong and the timing wrong.
Not slightly wrong. Structurally wrong, because it is modeling a different payment mechanism with different mechanics.
Source four: the shape of the week, and what it costs
The same transactional base reveals something about time that no survey would think to ask.
Monday concentrates more than double the domestic ticket issuances of any weekend day. The peak sits at 11 in the morning. Volume declines every day from there through Saturday, the quietest day on the calendar, and the cycle restarts.
That concentration has a price attached. Comparing domestic tickets issued for Monday morning departures against the same routes on Tuesday through Friday, in the same six to noon window, Monday averaged 2,095.22 reais against 1,314.73 reais. That is 59.4 percent more for the identical trip taken a day later, across 930 paired domestic routes and 11,874 Monday morning issuances between August 2025 and July 2026.
I changed my own behavior after seeing that number. I now schedule my trips Tuesday through Thursday whenever the calendar allows. The company pays less and I skip the Monday security line, which is the rare case of a data finding with an immediately actionable personal conclusion.
The geographic concentration compounds the temporal one. Pulling route frequencies from Flightradar24 in August 2026, the busiest route out of São Paulo’s downtown airport is the shuttle to Rio de Janeiro, at 368 flights per week. The second busiest, to Brasília, runs 167. The leading route carries more than twice the frequency of the next one, and roughly as much as the second and third combined.
For comparison, New York’s LaGuardia leads with Chicago at 227 flights per week, followed by Toronto at 162 and Atlanta at 159. Busier at the top, far flatter overall, and spread across a continent rather than concentrated in one corridor.
Two airports that global aviation analysis routinely places in the same category are doing structurally different jobs.
Source five: the other half of the trip
Air is only one side of a business trip, and the hotel data tells a story that runs in a different direction.
The Brazilian hotel operators’ forum publishes a monthly report covering hotels in associated chains. In July 2026, across a sample of 570 hotels representing 90,306 rooms, occupancy fell 1.3 percent against July 2025 while the average daily rate rose 5.3 percent, from 403.15 to 424.37 reais. Across January through July, occupancy was essentially flat at plus 0.5 percent while the average rate rose 5.4 percent.
The sector is billing more without hosting more people.
The category breakdown sharpens it. In July, the upscale segment was the only one with positive occupancy growth, up 0.5 percent, while the economy and midscale segments lost 1.4 and 1.7 percent respectively. Rates rose in all three.
The top of the pyramid is filling. The base is not.
I have written before about how the corporate travel market here is growing in price rather than in trips. The hotel data confirms that pattern from a completely independent industry, measured by a different organization using a different methodology.
Where the sources disagree, and why that matters
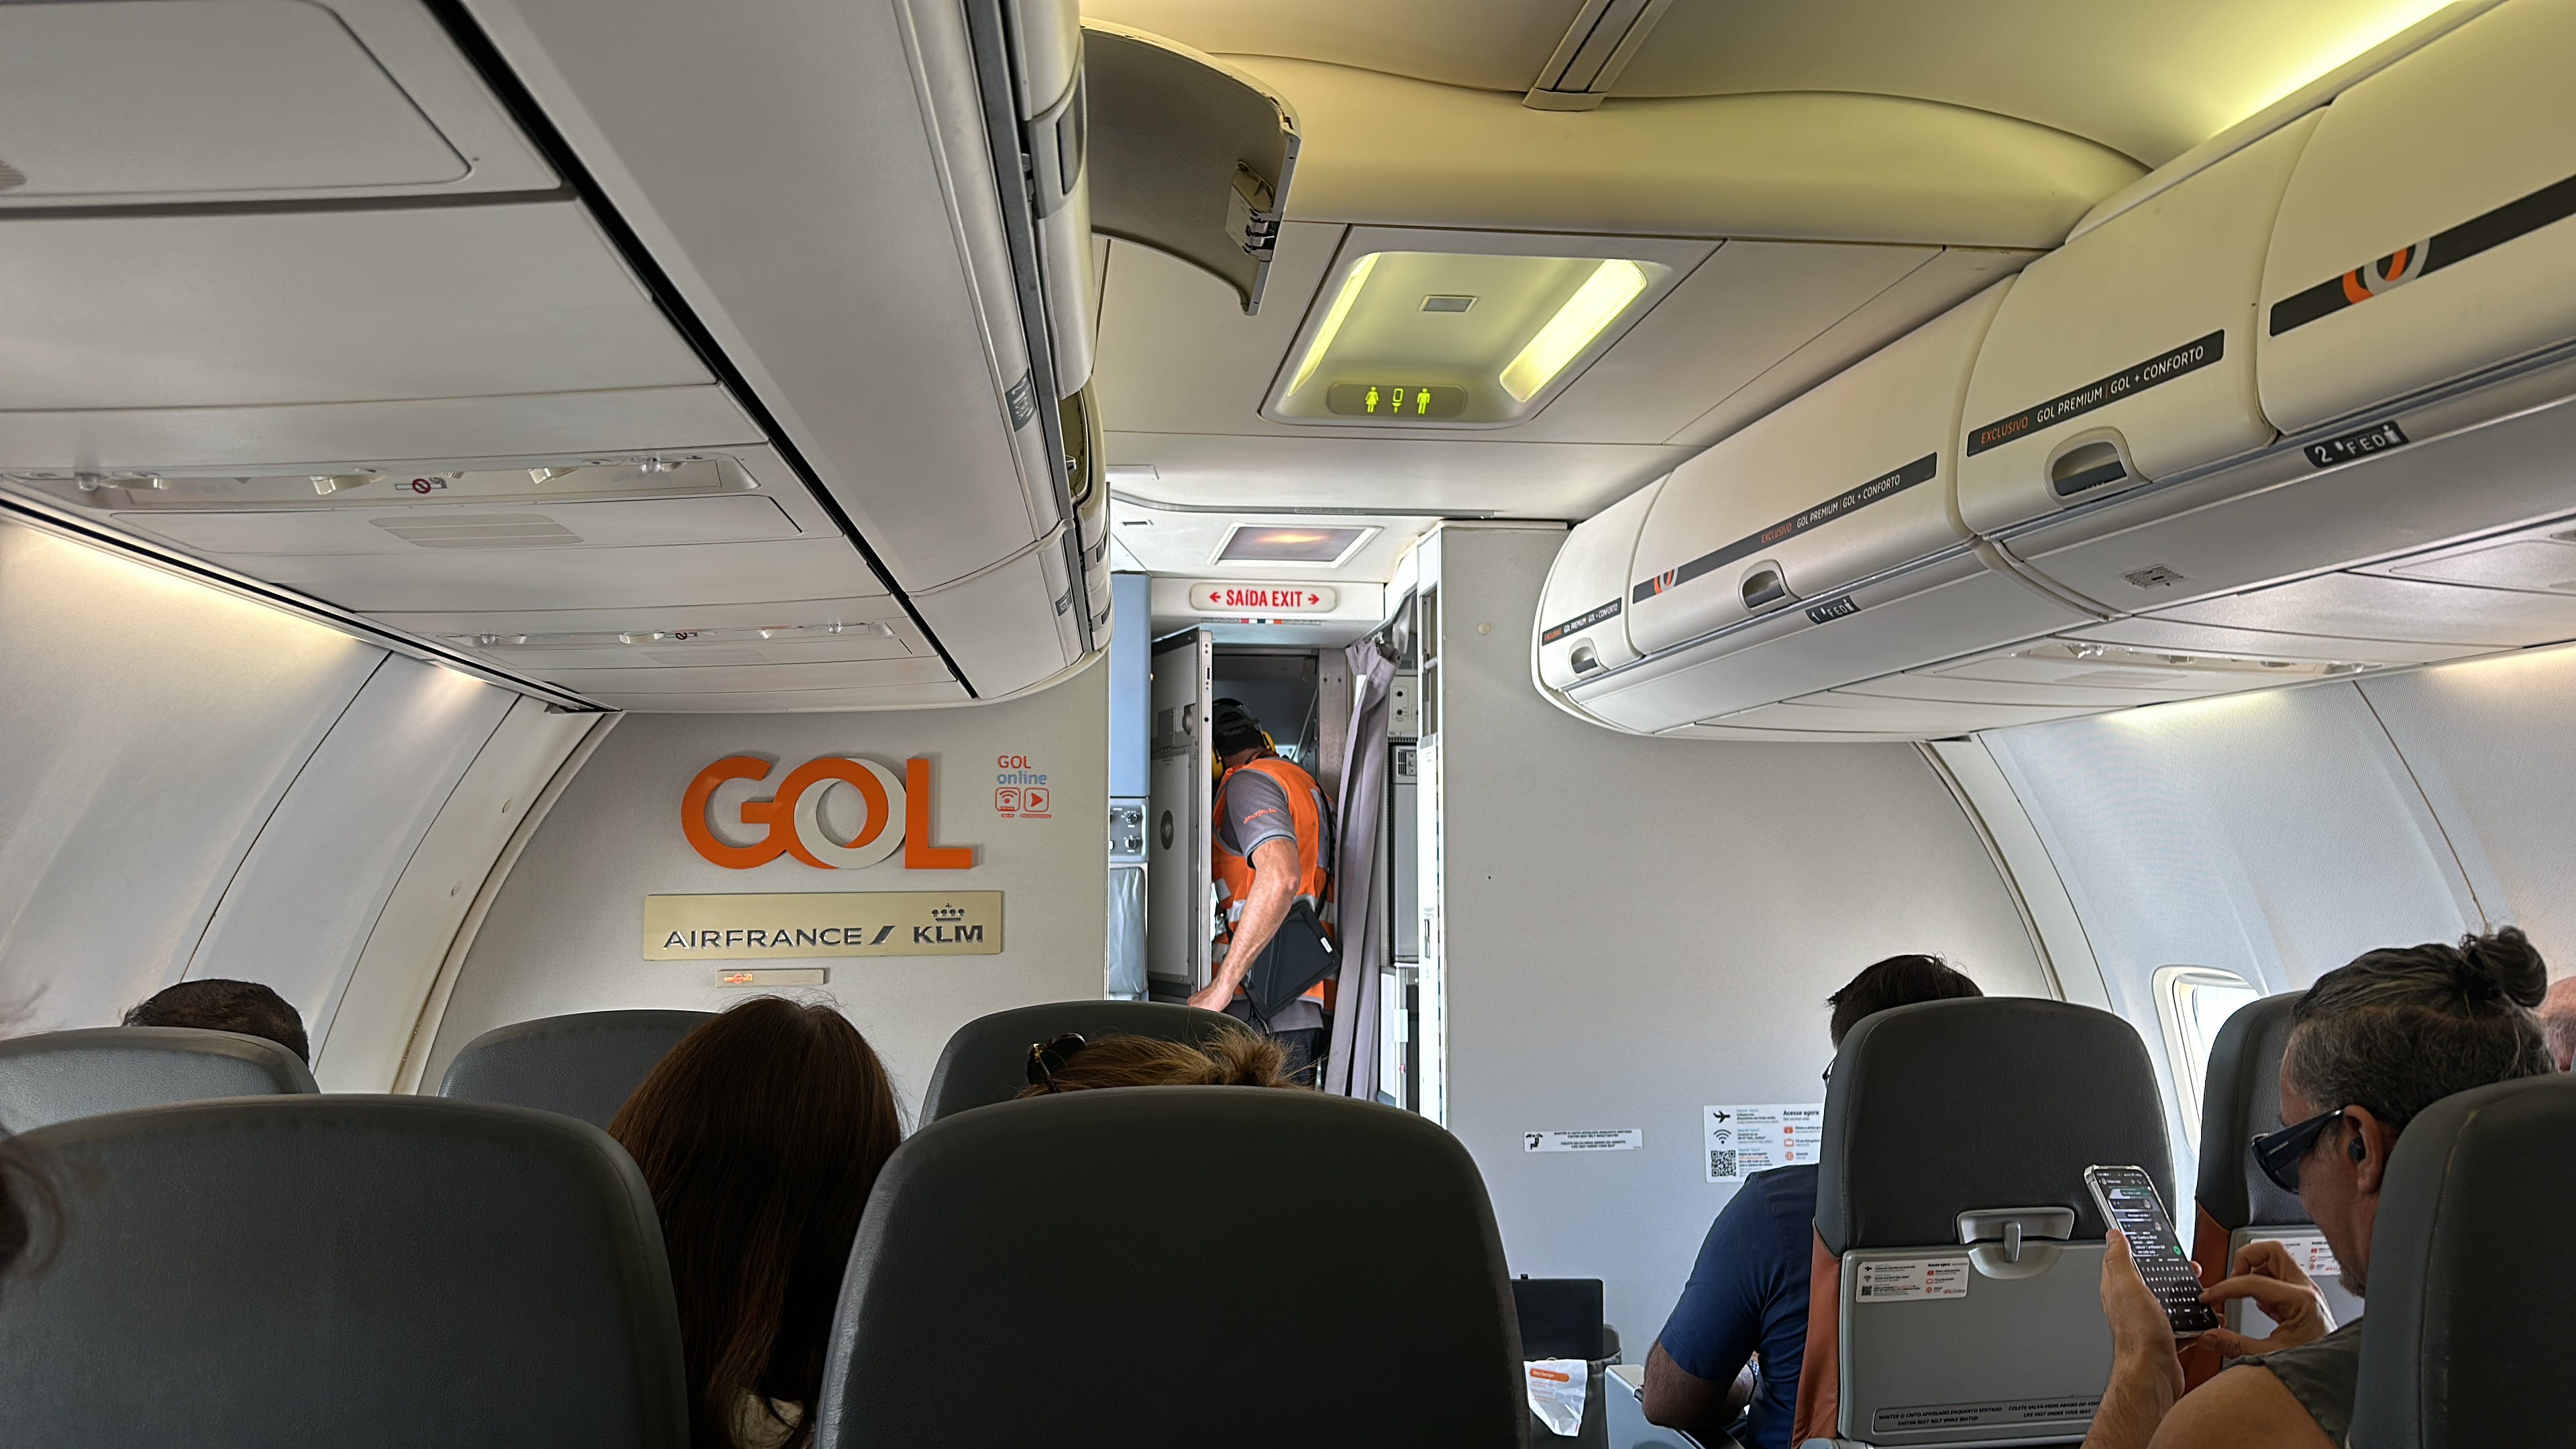
Here is the part that would be lost in any summary treatment, and it is the most interesting finding in this piece.
According to the national aviation regulator, the average real domestic airfare in July 2026 was 703.52 reais per leg, down 5.2 percent against July 2025. In the same month, the hotel rate rose 5.3 percent. Two halves of the same trip moved in opposite directions.
Part of that gap is methodological. The regulator publishes in real terms, adjusted for inflation, while the hotel report publishes nominal figures. With inflation running near 5 percent, the hotel increase is close to flat once adjusted. Anyone placing those two numbers on the same chart without that adjustment would be comparing different things.
And there is a detail in the regulator’s methodology that matters more than any of this for anyone reading it as a corporate travel figure: the calculation excludes tickets purchased at corporate rates, with miles, or through discounts not available to the general public. The official national airfare index does not, by design, observe corporate travel.
The airfare year also has a shape worth noting. In real terms, fares ran 17.8 percent above the prior year in March, 9 percent in April, 11.2 percent in May, 0.3 percent in June, and then turned negative in July.
The price pressure that dominated the first half of the year reversed at midyear, which is not the story anyone was telling in March.
What this adds up to

Five sources. Two measuring the market’s size from opposite directions and disagreeing productively. One measuring what people actually paid, at a level of detail no survey reaches. One measuring the other half of the trip. One official index that explicitly excludes the segment this blog is about.
None of these findings would appear in a global corporate travel report, and the reason is not negligence. The samples were not designed to see them. Instant payment dominance, a work week that concentrates demand into a single morning, a downtown airport carrying a single corridor at twice the frequency of its next route: these are structural features of one market, and structural features are exactly what a global average smooths away.
I do not think this makes global research less valuable. The most useful thing I took from three days at a global industry convention this year was how much of what circulates as settled industry knowledge is a finding from one place that traveled well. The research is good. The travel is the problem.
The correction is not to complain about the sample. It is to produce the missing data. That is why Alagev counts every month, why we publish what our own transactions show, and why the regional picture keeps looking different from the global one every time somebody bothers to look directly.
A market that measures itself gets to argue with the people describing it. A market that does not gets described anyway, by people working from a sample that never included it, in a footnote nobody reads.
About me

I am an entrepreneur with over 20 years of experience at the intersection of tourism and technology. I am co-founder and Chief Business Officer of VOLL, the largest mobile-first corporate travel and expense management platform in Latin America, and a recognized reference in the development of the corporate travel industry.
A Marketing specialist from Fundação Dom Cabral, I serve on the Tourism Council of FecomércioSP and on the Executive Council of the Latin American Association of Corporate Events and Travel Management (Alagev). A frequent traveler and close observer of human behavior in motion, I write and speak about innovation, digital transformation, entrepreneurial leadership, and the future of corporate travel.