



There is a table in a new GBTA study that almost everyone is going to read the wrong way. It lists 25 of the world’s leading business-travel cities by how much business travelers spent in each one in 2024, and the moment you publish a list like that, people turn it into a leaderboard.
New York on top, a familiar cast behind it, and somewhere near the bottom the two Latin American cities that made the cut, which invites a tidy and lazy conclusion about who matters and who is catching up. I want to argue the opposite, because the genuinely interesting finding in the GBTA and Rockport Analytics study on business travel’s economic impact in global cities is not the ranking at all. It is what happens to a dollar of business travel after it lands.
I should say plainly that I am not a neutral reader here. I run a company on the corporate travel side of this industry, I am based in São Paulo, and this week my own team helped put the São Paulo numbers from this very study in front of the Brazilian press. So I have both a professional interest in the topic and a local stake in how one of these cities gets talked about. With that on the table, let me make the case that the destination lens, not the spending rank, is where the value of this report lives.
What a business trip actually leaves behind

Start with the mechanism, because it reframes everything that follows. Across the 25 cities, business travelers spent roughly 178 billion dollars in 2024, about 12 percent of the worldwide total of 1.47 trillion. That is the headline most coverage will stop at. The number that matters more is what that spending set in motion once it arrived. The study finds that every dollar of direct business-travel spending supported about 1.59 dollars of total local economic activity, the extra 59 cents rippling out through suppliers, wages, and the everyday spending of the people those wages employ.
Run that multiplier across all 25 cities and the picture changes scale entirely. Business travel drove roughly 283 billion dollars in total output, about 93 billion in GDP, nearly 1.4 million jobs, and around 55 billion dollars in tax revenue, a point the broader coverage of the study has rightly seized on. Sit with that tax figure for a second. Fifty-five billion dollars is not a rounding error in a municipal budget. It is schools, transit, and sanitation, funded in part by people who flew in for two nights, ate dinner, took a meeting, and left. A business trip looks like a cost to the company that pays for it and like income to the city that receives it, and the study is really a careful accounting of that second half, the half the traveler never sees.
The ranking is real, and it is also a trap

Now to that leaderboard, because it does contain a true fact before it tempts you into a false one. Spending is concentrated. The seven cities that each cleared 10 billion dollars accounted for 61 percent of the total, about 108 billion, led by New York at 21.2 billion, Tokyo at 20.7, London at 15.0, and Paris at 13.6. If scale were the only question, you could stop reading there and conclude that business travel is a big-city, rich-market phenomenon and go home.
The trouble is that scale answers a different question than the one a mayor or a finance director actually cares about. Look one column over and the neat ranking dissolves into something more interesting. Tokyo supported more jobs than New York, roughly 158,000 against 139,000, on slightly less spending. Paris turned its 13.6 billion into 8.3 billion of GDP, a richer conversion than several cities above it. New York posted the highest multiplier of the group at 1.76, meaning each dollar there did more downstream work than almost anywhere else, as GBTA’s own breakdown of the city data lays out. The lesson is not that the ranking is wrong. It is that a single column cannot tell you whether a city is winning, because different cities are playing for different prizes, some for sheer volume, some for jobs, some for tax yield, some for GDP per dollar.
The most revealing number is jobs per dollar

If I had to pick the one metric from this study that deserves more attention than the spending rank, it would be employment intensity, the number of jobs each billion dollars of business travel supports. This is where the destination lens earns its keep, because it measures something cities genuinely compete on, which is how efficiently a dollar of visitor spending turns into local work.
The spread is enormous and it does not track the spending table at all. At the high end, Delhi supported roughly 42,900 jobs per billion dollars of business-travel spending, a ratio that dwarfs the big Western hubs where the same billion dollars buys far fewer jobs because labor costs more. And sitting near the top of that efficiency list, well above most of the wealthy cities that outrank it on raw spending, is Mexico City at about 24,100 jobs per billion dollars. A city can be modest on the spending table and quietly be one of the most powerful job-creation engines in the entire dataset. That is the whole argument against reading this as a leaderboard, captured in a single statistic.
Set against the study’s average of roughly 7,800 jobs for every billion dollars of spending across all 25 cities, the spread that the GBTA release documents is the difference between a dollar that mostly covers rent and premises and one that mostly covers people. For a wealthy city with high labor costs, business travel adds welcome output and tax at the margin. For a city where a dollar hires more hands, the same inbound spending is closer to an employment program that happens to arrive by plane. Those are not better and worse outcomes. They are different economies converting the same input, and a ranking by spending hides exactly that difference.
Two Latin American cities, and what they are really telling us
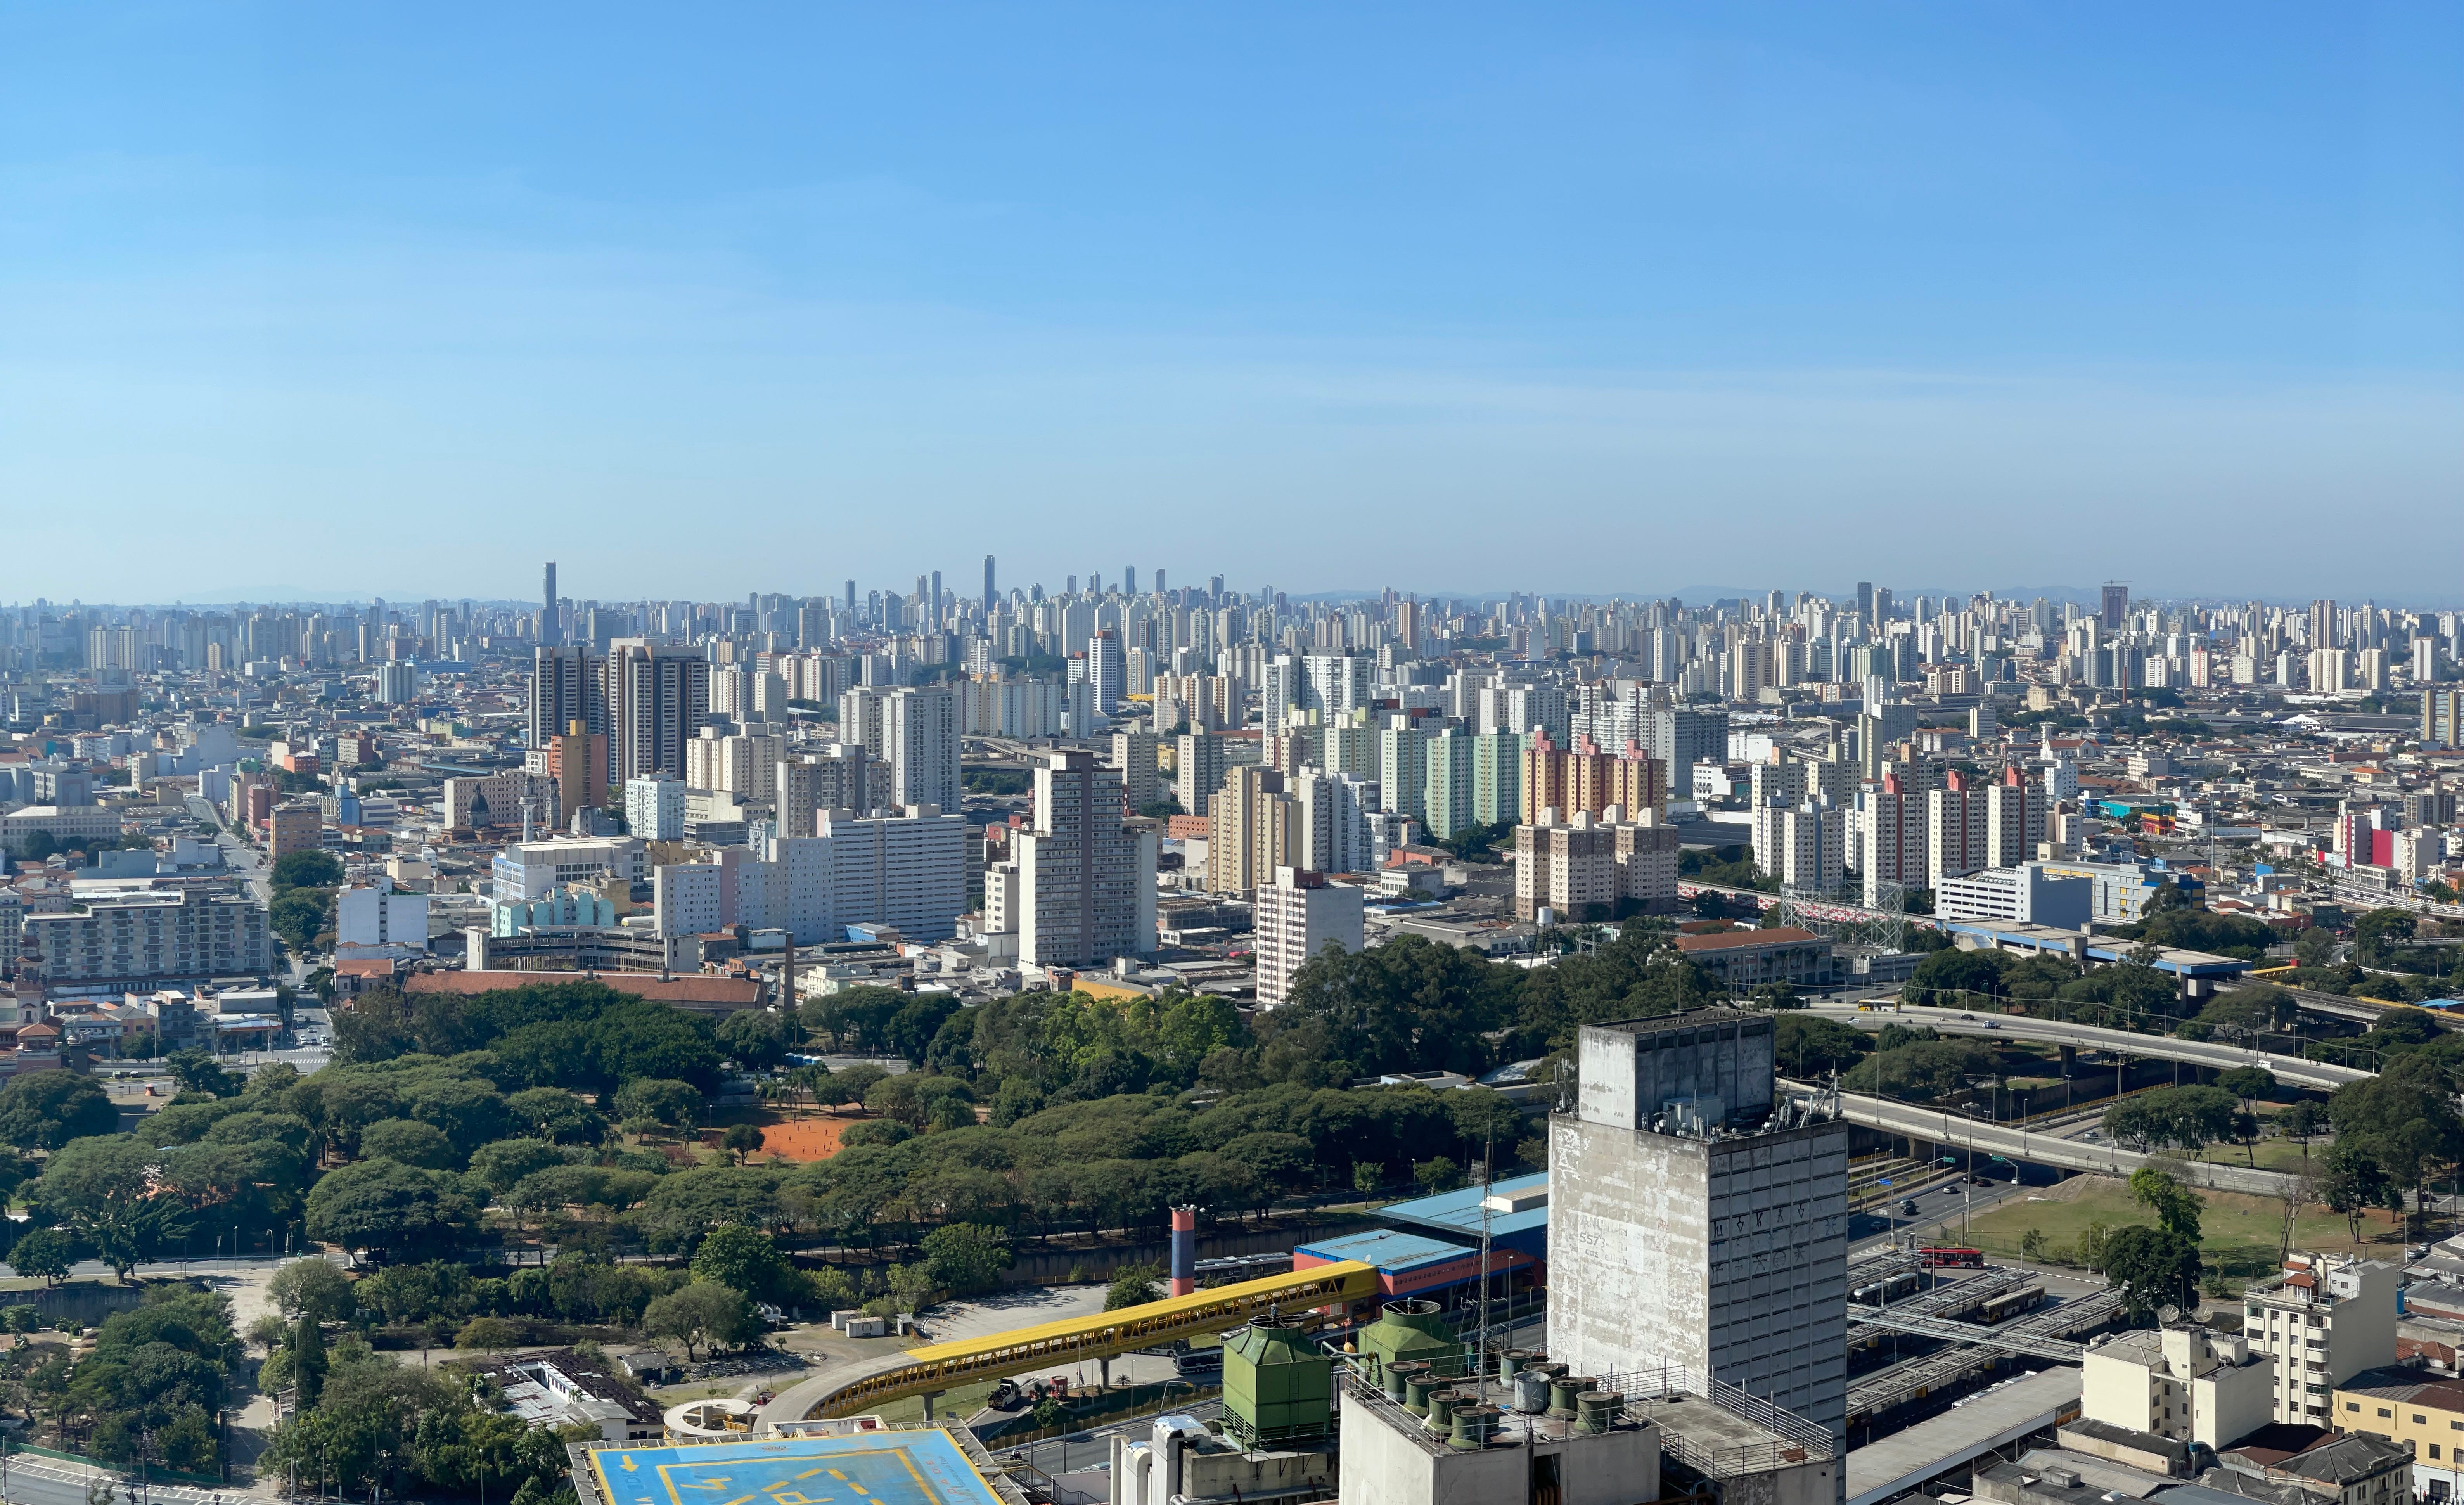
Only two Latin American cities made the 25, São Paulo and Mexico City, and both sit low on the spending column. The easy story writes itself, and it is the wrong story. Here is the better one, starting with the city I know best.
In 2024, business travelers spent about 2.4 billion dollars directly in São Paulo, and that spending rippled into roughly 3.4 billion dollars of total economic activity, supporting around 33,000 jobs, close to 700 million dollars of GDP, and some 400 million dollars in tax revenue, figures now circulating in the Brazilian press through coverage of the study’s São Paulo numbers. The employment intensity behind that is striking, close to 13,800 jobs for every billion dollars spent, far above what the same money produces in most of the higher-ranked cities. Mexico City tells a similar story with its own numbers, converting a comparatively small spending base into one of the richest job yields in the study.
So the accurate way to read Latin America’s place in this report is not as a straggler on a spending chart. It is as a region where business travel punches well above its dollar weight in exactly the currency that matters most to a developing economy, which is employment. The gap between São Paulo’s 2.4 billion and New York’s 21.2 billion is not a verdict on the cities. It is the size of the opportunity, and it is an opportunity measured in jobs, not vanity. Treating that as a deficiency would miss the point the data is making, which is that the Latin American dollar is already working harder than most.
Business travel as development policy, not a convenience

What should a city actually do with a study like this? The honest answer is that most cities still file airports, convention centers, and hotels under convenience, a nice-to-have that serves visitors, rather than under economic development, an engine that serves residents. The destination lens is an argument for moving them from the first column to the second. When a finance secretary can see that the inbound business traveler leaves behind wages and tax receipts for the person who never travels at all, the calculus around route incentives, visa friction, airport capacity, and event bidding stops looking like hospitality spending and starts looking like industrial policy.
This is also, I will admit, close to the work I do, so take the disclosure with the point. The reason I find a study like this useful is that it insists on visibility into where the money goes, and visibility is the thing corporate travel chronically lacks. I have argued before that the value in this industry hides in details that are hard to count, and the city data is the same lesson at the scale of a metropolis. A company that cannot see the full cost and effect of a trip manages it badly. A city that cannot see the full economic return of its inbound travel underinvests in it. The fix in both cases starts with measuring the right thing, which is why a report that counts jobs and taxes rather than just spending is more than an interesting read. It is a better scoreboard.
What this looks like from where I sit
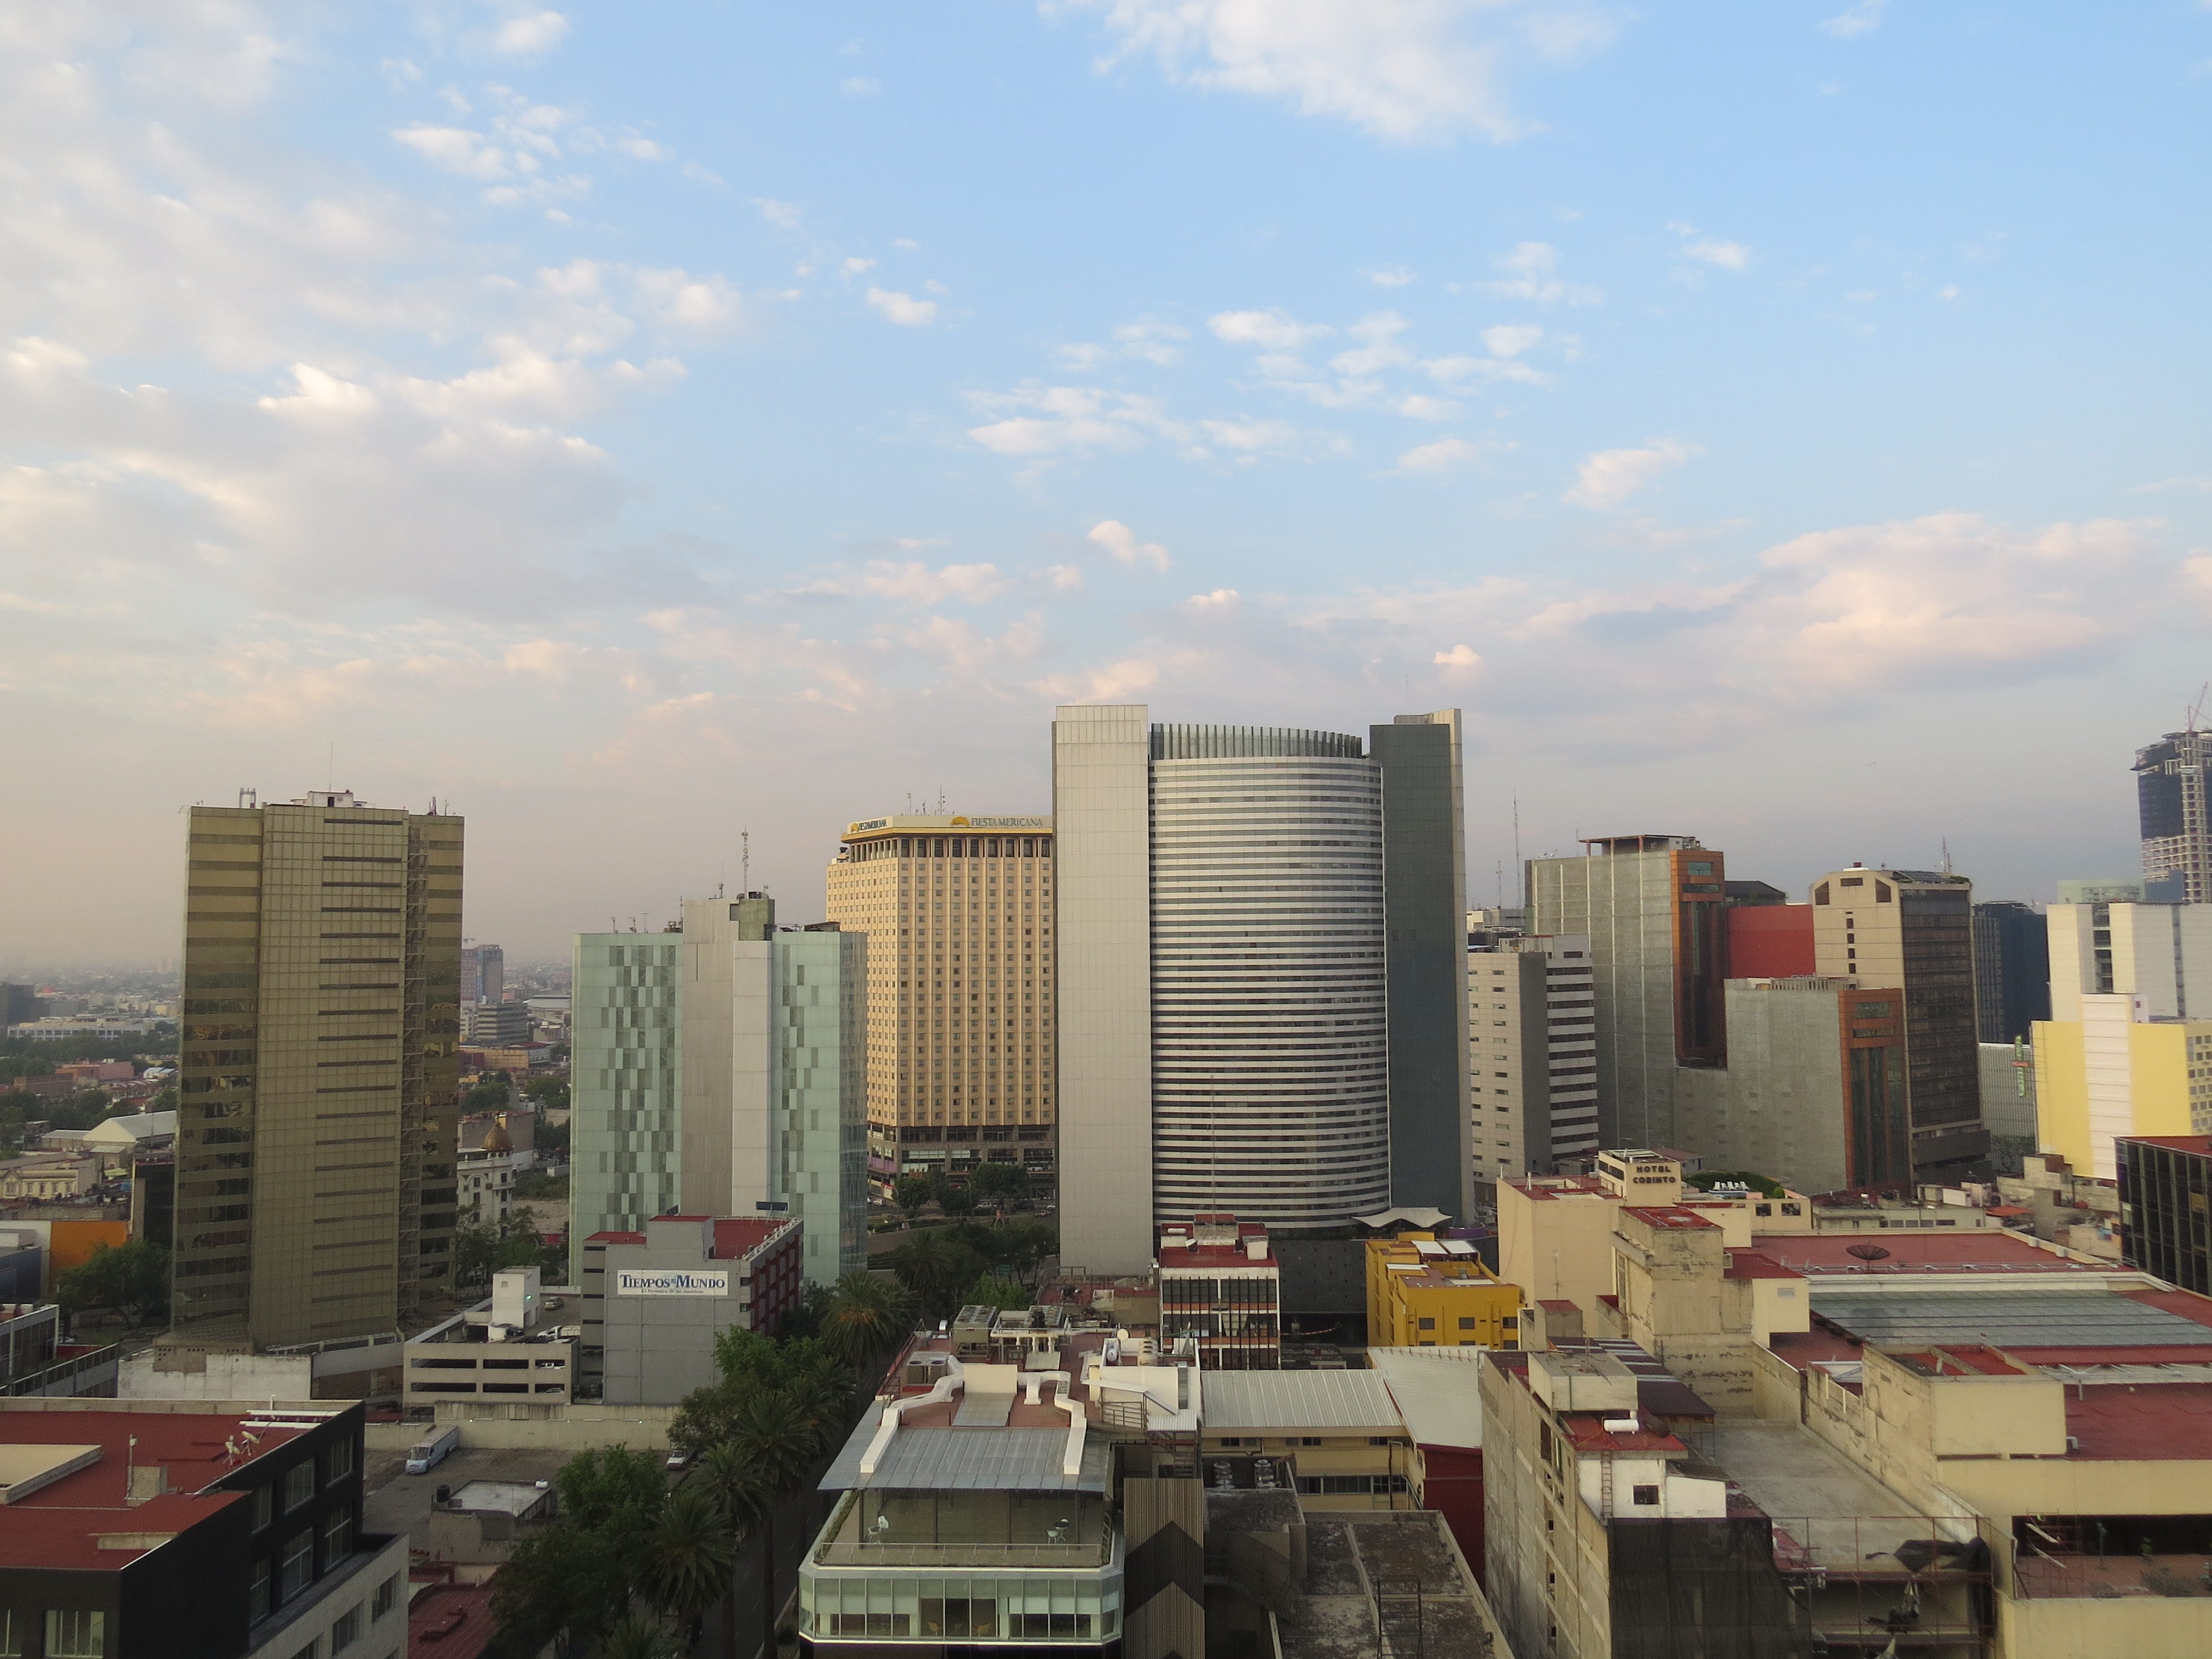
I will close from São Paulo, with optimism rather than complaint, because the numbers earn it. There is a tired habit of treating Latin America’s smaller figures in global studies as evidence that the region is behind, and this report is a clean example of why that habit misreads the data. Two of our cities turned modest spending into some of the highest employment returns measured anywhere in the world. That is not the profile of a laggard. It is the profile of a region that already does the hard part well, converting activity into livelihoods, and now has room to grow the activity itself.
The work ahead is to expand the base without losing that efficiency, to attract more of the 1.47 trillion dollars that global business travel represents while keeping the job yield that makes each dollar count for so much here. That is a growth story, and it connects to a point I keep coming back to, that this is the most optimistic corner of the travel industry to be building in right now. It also depends on the unglamorous infrastructure that makes a city easy to do business in, the same steady, compounding investment in the traveler’s experience that separates the cities people choose to meet in from the ones they route around. Latin America has the demand and the human return. The invitation in this data is to build the structure that lets both grow.
The receipt the city keeps
So the next time a trip ends and someone files the expense report, it is worth remembering that the company’s receipt is only one of two. The city keeps a receipt too, written in wages and tax revenue, and for places like São Paulo it adds up to far more than the sum of the hotel bills. And the pool these cities draw from is still growing. The same body’s forecasting puts global business travel on a path well past its 2024 level, which means the receipt the city keeps only gets larger from here, for whichever cities decide to compete for it. Business travel was never only a line item. It is one of the quieter engines a city has, and the useful thing this study does is hand everyone a clearer meter to read it by. The ranking will get the headlines. The jobs per dollar is the part worth keeping.
About me

I am an entrepreneur with over 20 years of experience at the intersection of tourism and technology. I am co-founder and Chief Business Officer of VOLL, the largest mobile-first corporate travel and expense management platform in Latin America, where I lead the commercial strategy behind our AI adoption.
A first-cohort graduate of The AI-Powered Organization at Stanford Graduate School of Business and a Marketing specialist from Fundação Dom Cabral, I serve on the Tourism Council of FecomércioSP and on the Executive Council of the Latin American Association of Corporate Events and Travel Management (Alagev). I write and speak about innovation, digital transformation, entrepreneurial leadership, and the future of corporate travel.