



Ask a room of frequent travelers what makes up the price of an airline ticket and almost everyone says fuel. They are right that fuel matters more than any other single input, and wrong about nearly everything that follows, because fuel has only been the largest line in airline cost structure intermittently, and in some years it is not the largest at all.
This article is an attempt at a complete answer to a question that gets asked constantly and answered badly: what exactly is inside the number on your boarding pass? I have spent two decades on the buying side of that number, and I co-founded a corporate travel and expense platform, so I have a commercial interest in companies understanding their own travel costs better.
Read the analysis with that in view. The figures below come from regulators, airline financial filings, and the industry’s own trade association rather than from my TMC’s data.
The first distinction: what you pay is not what the airline spends
Before any cost breakdown makes sense, two different things have to be separated, because conflating them is the single most common error in this conversation.
The first is the composition of the price you pay, which includes the fare the airline sets plus government taxes, airport passenger charges, and in some markets carrier-imposed surcharges. Some of these are the airline’s revenue. Others are collected by the airline and passed straight through to somebody else.
The second is the airline’s own cost structure, the money it actually spends to operate the flight. Fuel, crew, aircraft, maintenance, airport fees, distribution. These shape the fare the airline is willing to offer, without ever appearing as a separate line on your receipt.
A passenger charge you can see on your ticket and a cost the airline carries are different categories of thing. In Brazil, ANAC explicitly defines the boarding fee as the only charge a passenger pays for using the airport, separate from the landing, parking and connection fees that the airline pays and that never appear on the passenger’s receipt at all. Everything that follows is organized by that distinction.
Fuel: the input that reorders everything else
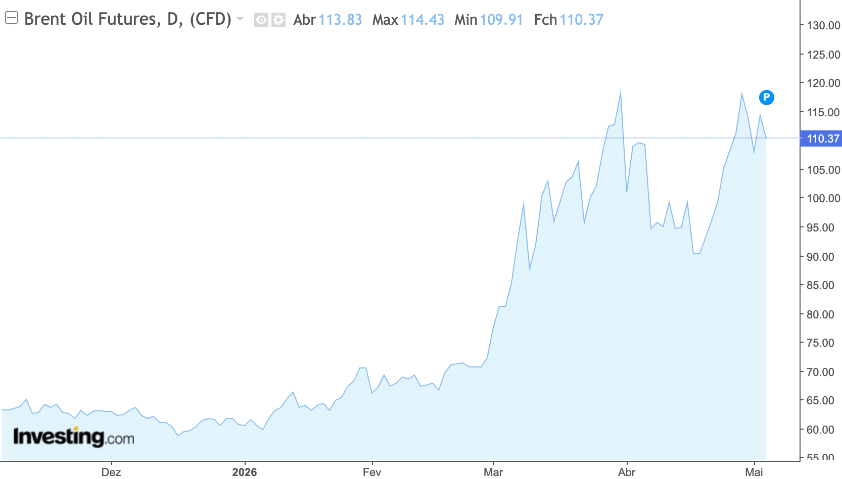
Fuel is where every serious analysis starts, because it is the most volatile major input in the entire structure and because its share moves enough to change the ranking of everything below it.
Across the global industry, IATA’s World Air Transport Statistics put aircraft fuel and oil at 28.7% of total airline costs, followed by depreciation and amortization at 9.1% and flight crew salaries at 8.6%. The regional spread inside that average is the number worth memorizing: fuel represents 36.3% of total airline costs in Latin America and the Caribbean against 25.5% in North America, according to IATA’s own breakdown of the data.
A Latin American carrier is structurally more exposed to a fuel shock than a North American one by roughly eleven percentage points of its entire cost base, before anyone discusses hedging, currency or route economics.
That exposure stopped being theoretical this year. IATA now expects jet fuel to reach 31.4% of global airline operating expenses in 2026, against 25.4% in 2025, with the industry’s total fuel bill climbing from about $252 billion to roughly $350 billion. The premium of jet fuel over crude, known as the crack spread, has run near a historic high, which means this is partly a refining story rather than purely a crude oil story, as IATA’s fuel fact sheet documents. Anyone tracking this in real time can watch it move weekly through IATA’s jet fuel price monitor.
In Brazil the mechanism has its own local shape. Petrobras raised jet fuel prices by 13.9% on average effective September 1, adding R$ 0.68 per liter and bringing refinery prices to between R$ 5.44 and R$ 5.70 depending on the plant, which brought the cumulative increase since January to 53.3%, or R$ 1.94 per liter, as Aeroin reported.
Prices reset by contract on the first day of each month, which gives Brazilian operators something rare: a cost shock with a known calendar.
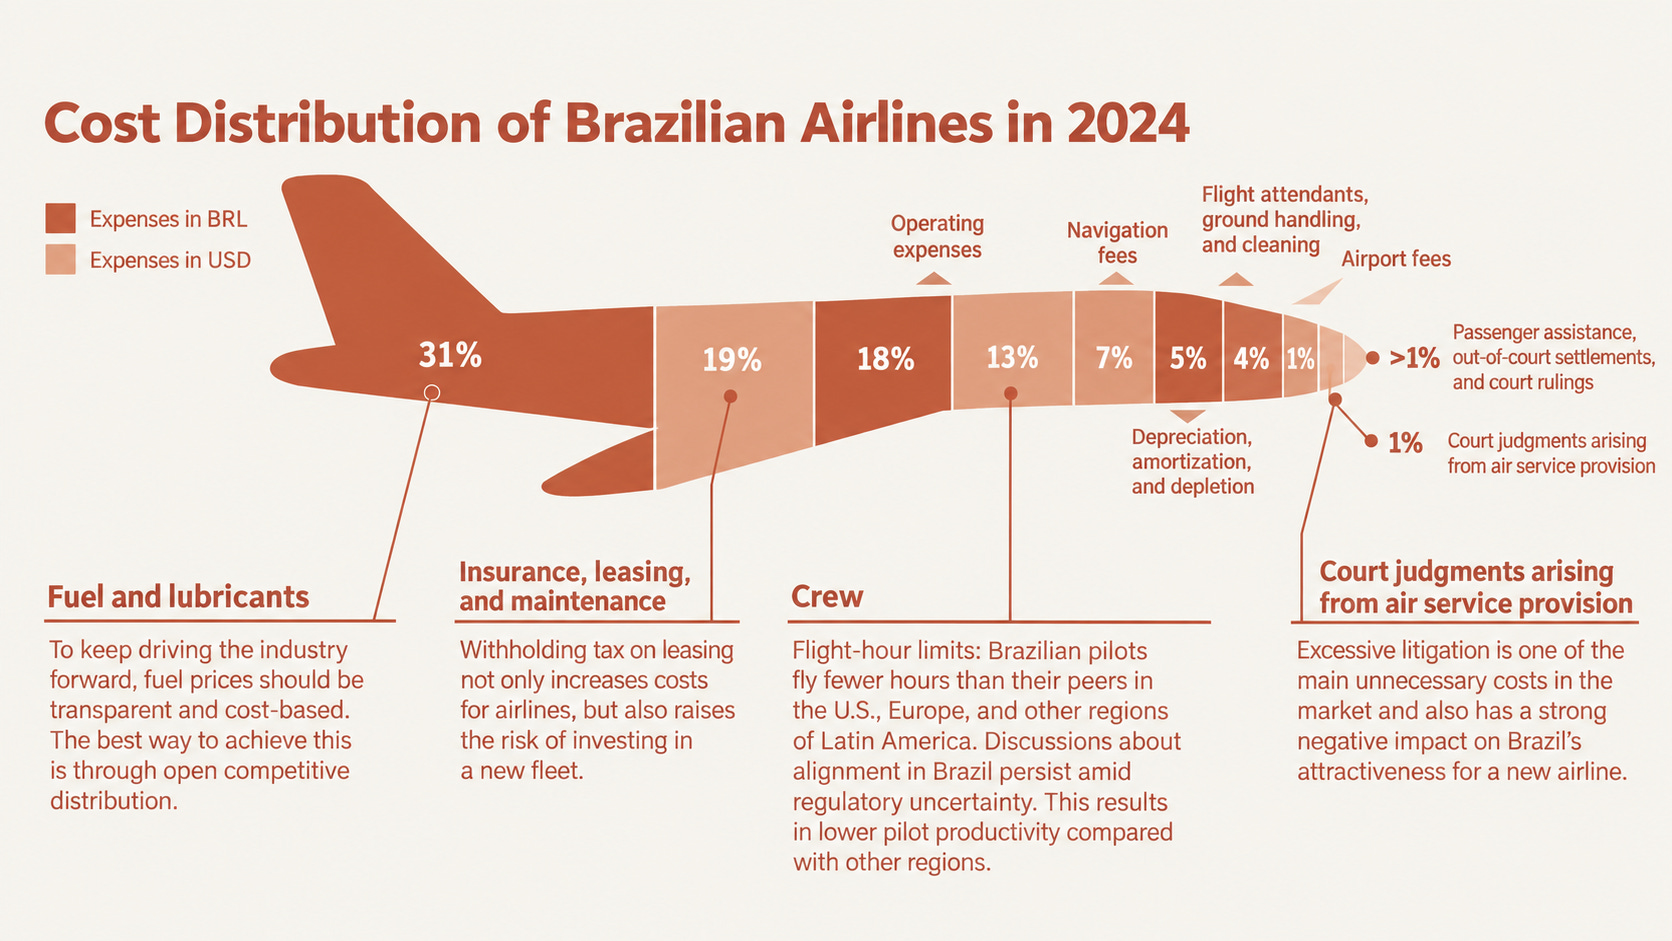
Two Brazilian figures put the scale in context. Abear, the association representing the country’s major carriers, says fuel has gone from about 30% to roughly 42% of operating costs, that fuel increases added R$ 6.3 billion to Brazilian commercial aviation’s cost base this year, and estimates that every R$ 1 added per liter of jet fuel is associated with 225,000 fewer passengers carried, figures compiled by Economic News Brasil.
At a congressional hearing, ANAC put jet fuel at roughly 30% of the composition of the ticket price sold to the passenger, the single largest component, and told legislators the price had climbed 100% between February and May, according to the agency’s own account.
Note that these two framings differ. Thirty percent of the passenger ticket price and 42% of airline operating costs measure different denominators. Anyone comparing fuel-share figures across sources needs to check which one is being used, or they will build a false trend out of two unrelated numbers.
Labor: the line that was the largest before fuel took the title back

Here is a fact that surprises most people outside the industry. In IATA’s December 2025 outlook, before the fuel shock landed in full, labor was the single largest cost component at 28% of the total, with non-fuel costs forecast at $729 billion, up 5.8% year over year. Wage growth has been outpacing inflation amid tight labor market conditions, and the industry has struggled to restore employee productivity to 2019 levels, because workforce growth has outrun gains in output per employee, as IATA laid out in that forecast.
Within labor, the costs split several ways that matter operationally. Flight crew, pilots and cabin crew, carry the highest hourly cost and the hardest constraints, because duty-time regulations cap how long a crew can work and mandate rest periods that vary by jurisdiction and flight length.
A long-haul flight may require an augmented crew, meaning extra pilots carried specifically to allow in-flight rest, which is a real cost with no revenue seat attached.
Ground staff, maintenance technicians, reservations agents and back-office employees sit in different cost centers with different pay structures and different degrees of outsourcing.
The structural point is that labor behaves almost nothing like fuel. Fuel can drop 20% in a quarter. Union contracts, training pipelines and certification requirements do not. Roughly speaking, fuel is the volatile line and labor is the sticky one, which is why a fuel spike temporarily makes fuel look dominant while labor remains the harder long-term problem for an airline’s cost base.
Aircraft: the cost of owning or renting the metal

An aircraft is the most expensive asset an airline touches, and how it is financed changes where the cost shows up in the accounts.
If the airline owns the aircraft outright, the cost appears as depreciation and amortization, 9.1% of total industry costs per IATA’s WATS data cited above. If the airline leases it, the cost appears as a lease expense instead. IATA reported in December 2025 that lease rates have reached record highs, pushing up ownership costs across the industry, while maintenance costs climb because of aging fleets and supply chain disruption affecting parts availability.
Maintenance deserves its own note, because it is the cost most invisible to passengers and among the most rigidly regulated. Aircraft undergo scheduled checks at intervals defined by flight hours, cycles and calendar time, ranging from routine overnight inspections to heavy checks that take an aircraft out of service for weeks.
Engine overhauls are separately enormous. None of it is optional, none of it can be deferred for commercial convenience, and delays in the parts supply chain mean an aircraft can sit grounded, earning nothing, while still costing its lease payment every single day.
The European air navigation performance body, drawing on IATA’s Airline Cost Management Group data, classifies these expenses in a way that helps: flight operating expenses are those tied directly to the aircraft and the flight, where fuel represents about 48% of the category, while ground operating expenses cover maintenance and overhaul, airport charges, station and ground handling, in the classification published by EUROCONTROL’s economics reference.
The ground: airport charges, navigation fees, and who actually pays them

This is the third-largest expense category in global aviation, after fuel and labor, and the one most travelers have never thought about.
Airport and air navigation service charges accounted for roughly 15% to 16% of global air transport costs in 2019 and remain the third-largest expense category, according to IATA’s fact sheet on aviation charges and fees. That figure understates reality in an important way.
EUROCONTROL’s reference notes that in many jurisdictions, airport charges levied on a per-passenger basis do not pass through airline profit and loss accounts at all, and Airports Council International estimates that over 50% of airport charges are collected per passenger, reaching as much as 80% in some regions. The money moves from traveler to airport with the airline acting as collector.
The charges themselves break into several distinct fees. Landing fees are usually calculated on aircraft weight. Parking or permanence fees accrue while the aircraft occupies a gate or remote stand. Connection fees apply to transferring passengers. Boarding fees are charged per departing passenger. Air navigation charges are paid to whichever authority controls the airspace the flight crosses, calculated on distance flown and aircraft weight, which is why a rerouting that adds distance adds cost twice over, in fuel and in navigation fees.
Brazil offers unusually transparent numbers here. The average domestic boarding fee across the country’s 30 largest airports runs about R$ 48.81 per passenger, against R$ 86.42 for international departures, with the highest international fee at Porto Alegre and the lowest at Campinas, according to a survey by Melhores Destinos. At São Paulo’s Guarulhos, the concession operator publishes its own numbers directly: R$ 35.75 domestic and R$ 68.61 international effective August 2026, available on the airport’s own tariff page, alongside a calculator for landing, parking and connection fees that airlines can use to model a route’s ground cost before flying it.
The regulatory architecture behind those numbers is worth understanding, because it explains why a boarding fee rises without anyone at the airline deciding anything. ANAC sets a ceiling revenue per passenger, the maximum an airport operator may collect from each traveler across all the fees that compensate a flight, and concession contracts include inflation-linked adjustment mechanisms designed to preserve the economic balance of the contract. The airport did not choose to raise the fee. The contract did.
Slots: the cost that never shows up in an income statement

At the world’s most congested airports, the scarcest input is neither aircraft nor crew. It is permission to use the runway at a commercially useful hour.
Slots are allocated under IATA’s Worldwide Airport Slot Guidelines, a framework the association has administered since 1970. As of the 2023 northern summer season there were 205 Level 3, fully coordinated airports worldwide, with 107 in Europe, 46 in Asia Pacific, 25 in North Asia, 14 in the Middle East and Africa, and just 13 across the Americas, according to an explainer of the slot system.
Those airports cover a large share of international traffic, and at that level a slot pair, the paired right to land and depart once daily, becomes an asset in its own right.
Three mechanics drive slot economics. Historic rights, often called grandfather rights, mean an airline that held and used a slot last season keeps it next season, which is why incumbents dominate the most congested hubs. The 80/20 rule requires an airline to use a slot at least 80% of the time or lose it, which is why carriers occasionally fly nearly empty aircraft purely to protect the right. Secondary trading at airports where it is permitted turns slots into transferable property.
The prices are remarkable. Oman Air’s 2016 purchase of a Heathrow slot pair from Air France-KLM for $75 million remains the benchmark transaction, with American Airlines paying $60 million for a pair from SAS in 2015 and $75 million for two more pairs in 2017, as catalogued in a review of the Heathrow slot market. Slot value depends on the regulatory environment, time of day, and season, with early morning arrivals commanding the largest premiums.
The asset is real enough that it has been used as collateral: Virgin Atlantic secured a £220 million note against its Heathrow slots, in what specialist appraisers describe as Europe’s first bond tied to airport slots, documented by the aviation valuation firm IBA.
None of that appears in a fare breakdown. It shapes the fare anyway, because a slot-constrained route has structurally less competition, and less competition is the most reliable predictor of a higher fare there is.
Catering and the cabin: small per passenger, enormous in aggregate
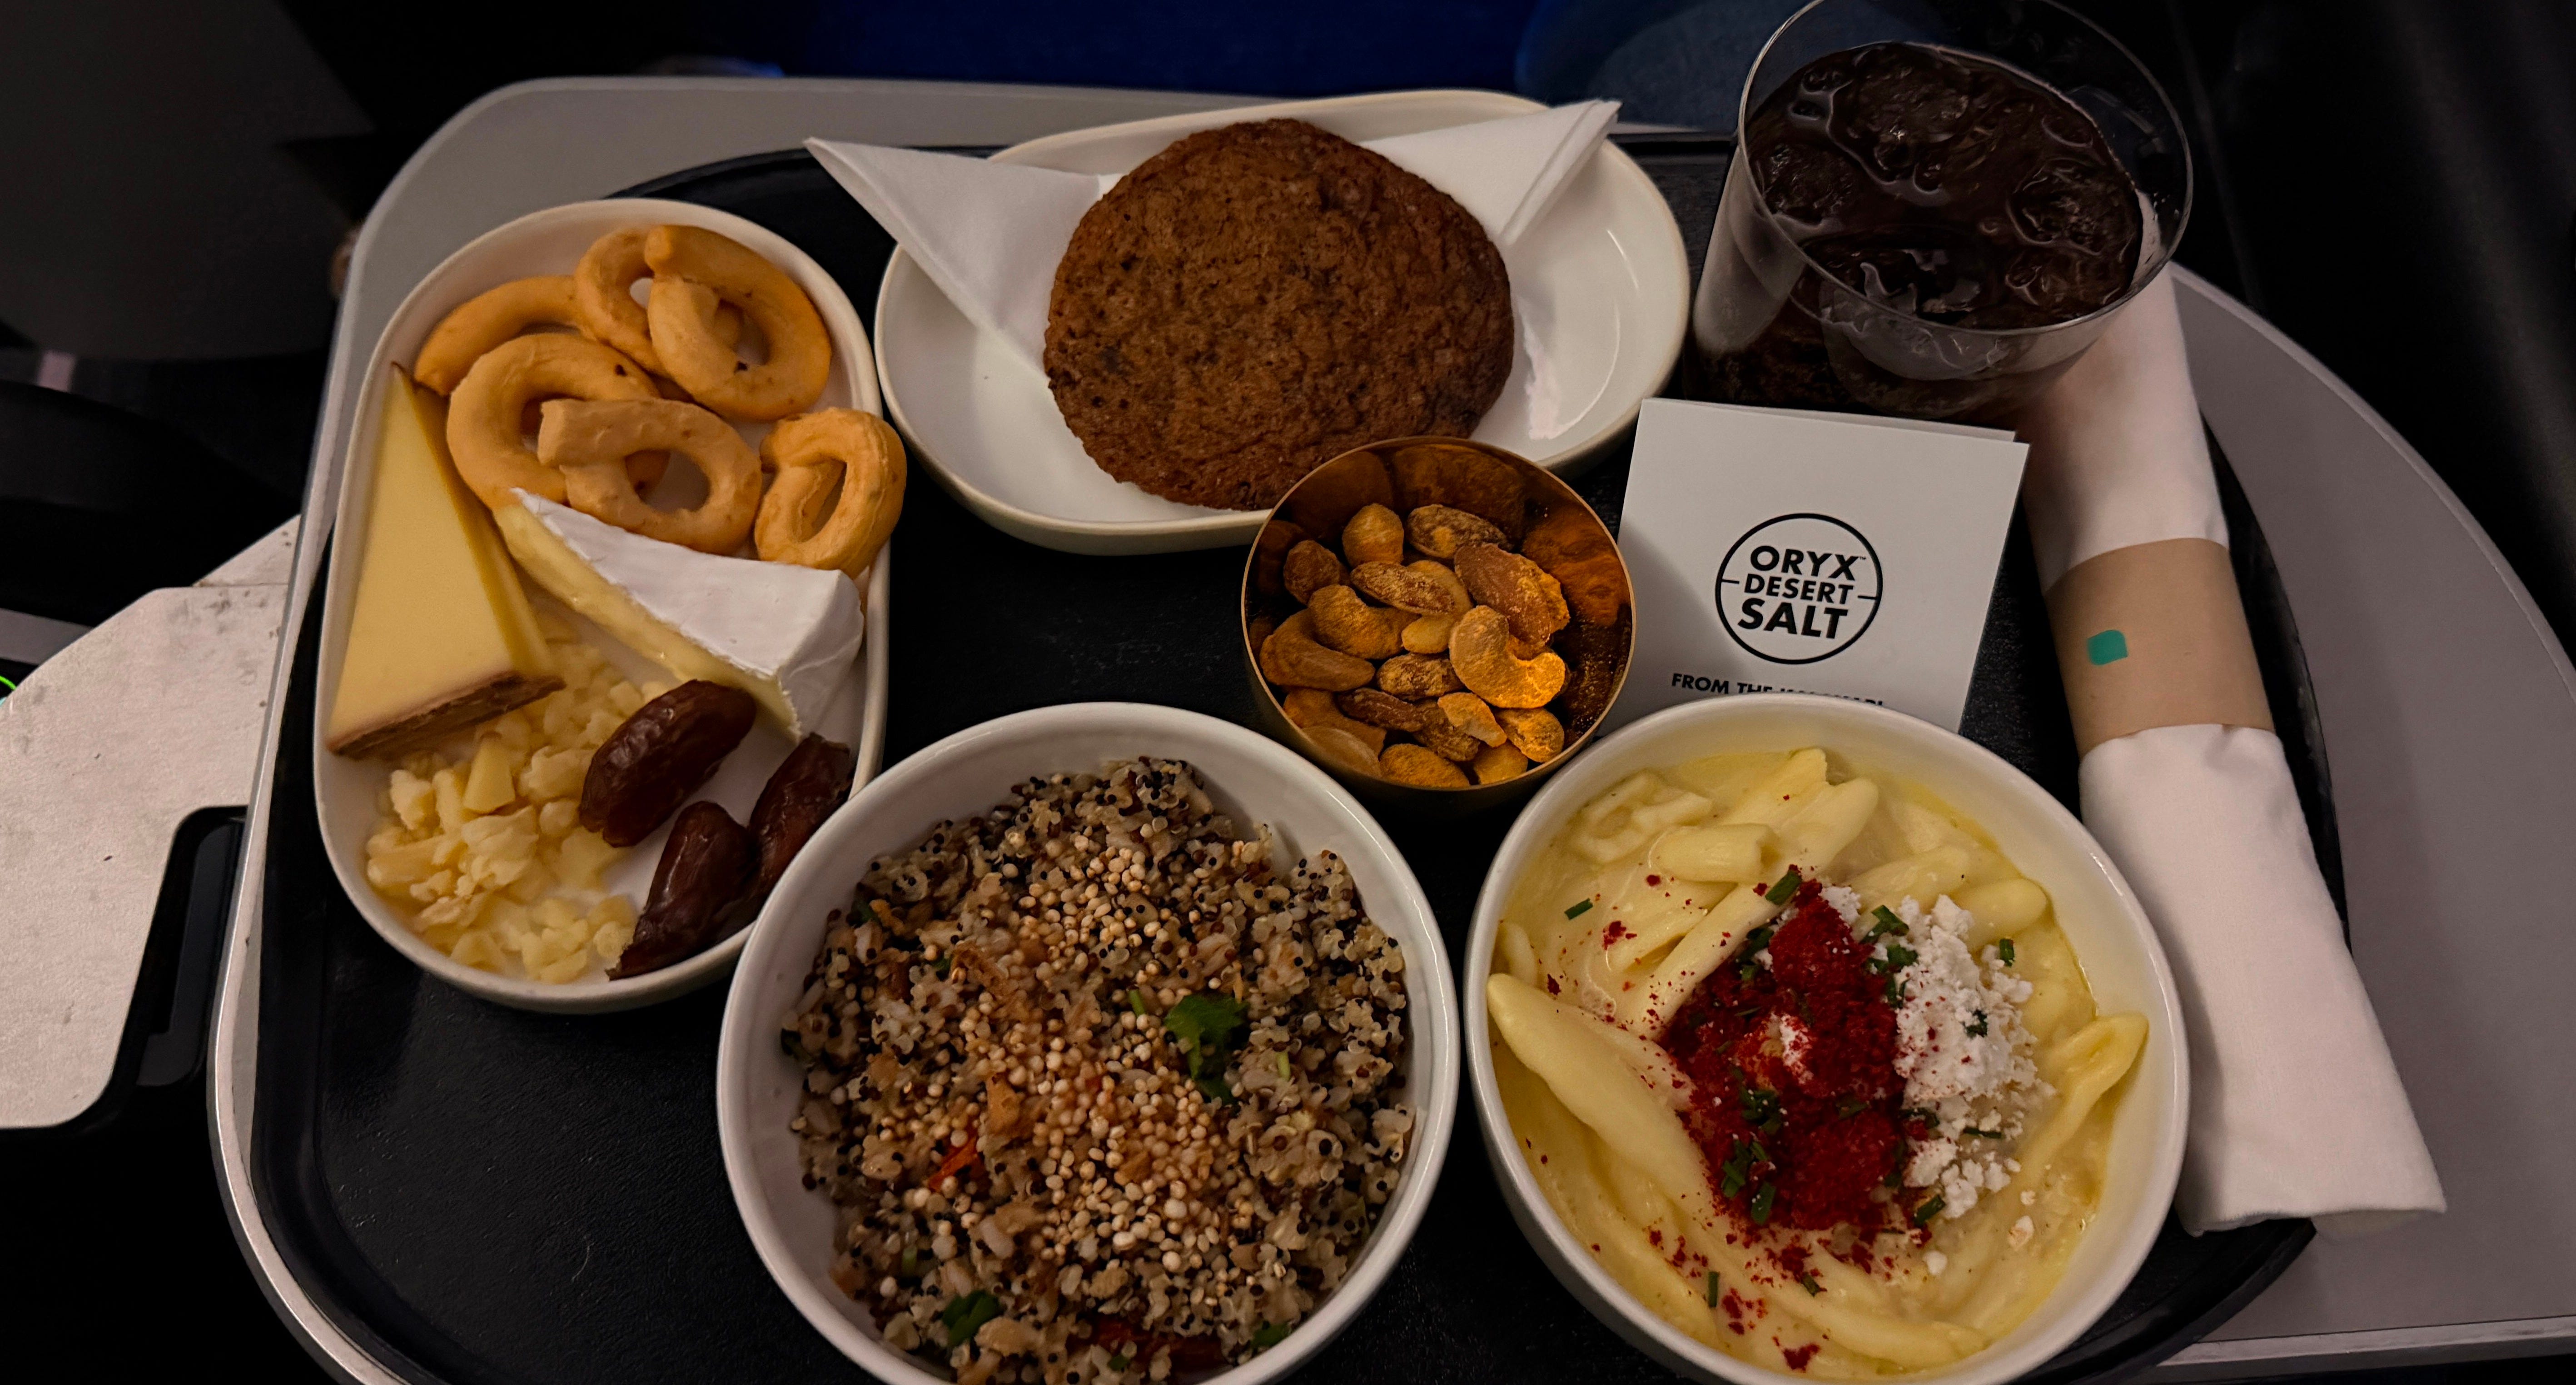
Catering is the cost passengers assume is large and is actually, per head, quite small.
Industry estimates put an economy meal at roughly $5 to $15 for the airline, a business class meal at around $30 to $50, and a first class meal at upwards of $100, with celebrity-chef offerings running far higher, according to a breakdown of airline catering economics. Historical U.S. Department of Transportation filings analyzed by Condé Nast Traveler found the ten largest domestic airlines spending an average of $3.61 per meal per passenger in 2015, down from about $4.79 in the late 1990s, as summarized in a review of that data.
Two things make catering matter more than those numbers suggest. The first is volume: a single large carrier serves hundreds of thousands of meals daily, and small per-unit differences compound into hundreds of millions of dollars annually. The second is weight. Every kilogram loaded onto an aircraft burns fuel for the entire flight, which means catering, water, and even the thickness of a seat cushion carry a fuel cost on top of their purchase cost. This is why airlines obsess over items that look trivially cheap.
Distribution: what it costs to sell the seat
The seat still has to be sold, and selling it is a cost line most travelers never consider.
Under the traditional model, a global distribution system charges the airline a fee per booked segment, commonly in the range of $4 to $6 per segment, or roughly $16 for a typical two-and-a-half segment ticket, plus charges for ticketing, refunds and other transactions, as described in a technical overview of GDS economics. Three systems, Amadeus, Sabre and Travelport, dominate this layer globally.
Airlines have been pushing back for a decade. Lufthansa Group pioneered the distribution cost charge in 2015, adding a surcharge to GDS bookings to steer agencies toward cheaper channels, and as of January 2026 that charge reached €18 per ticket for Amadeus bookings, €22.50 for Sabre and €23 for Travelport, against €8 for bookings made through the NDC standard, according to coverage of the latest adjustment. A gap of that size on a single ticket is not a rounding error, and it is the clearest available evidence of what legacy distribution actually costs a carrier.
For a corporate travel program, this layer is where fare differences appear that have nothing to do with the flight. The same seat can carry a different total cost depending purely on which pipe the booking travelled through, which is why distribution strategy has become a genuine line item in program negotiations rather than a technical detail for the back office.
Taxes and charges the airline never keeps
Some of what you pay was never the airline’s money.
Government taxes, airport passenger charges, and in some markets security or tourism levies are collected at the point of sale and remitted onward. Brazil’s boarding fee includes a percentage allocated to the national civil aviation fund and a tariff supplement defined in law, as set out in the official tariff schedules. The airline’s role is administrative.
This distinction matters more than it sounds. When a travel manager sees an average ticket price rise, part of that increase may be a regulated charge adjusting for inflation under a concession contract, entirely outside any negotiation with the carrier.
Separating the fare component from the pass-through component is the first step in knowing whether a program is actually losing ground on price or simply paying a higher regulated fee.
The currency layer, which works in opposite directions

Here is the part most analyses of Latin American aviation get backwards, and it is genuinely counterintuitive.
The common assumption is that a stronger dollar hurts every airline, since jet fuel, aircraft leases and maintenance are all dollar-denominated. IATA’s own forecasting supports the general version of that: a weaker US dollar benefits non-USD-based airlines by reducing dollar-denominated costs such as fuel, leases and maintenance, as stated in the December 2025 outlook cited above.
Then look at what happened to LATAM. The group’s functional currency is the US dollar, and its largest foreign exchange exposure comes from its Brazilian operation, whose revenues and costs are mostly in reais. In the first quarter of 2026, adjusted operating expenses rose 17.3% to US$ 3,328 million, driven by a 10.4% capacity expansion and by the appreciation of local currencies, with the real strengthening roughly 10% and the Chilean peso 8% against the dollar.
Adjusted passenger CASK excluding fuel rose 12.0% to 4.5 US cents, with local currency appreciation contributing about 0.2 cents of that increase, according to the company’s own results filing.
Read that carefully. A stronger real raised LATAM’s reported costs, because the company reports in dollars and pays a large share of its expenses in reais. For Gol and Azul, which report in reais while carrying heavily dollar-linked costs, the exposure runs the other way. The same currency movement produces opposite effects on two airlines competing on the same route, which is why any generic statement about exchange rates and airline costs is close to meaningless without knowing the carrier’s functional currency first.
How all of this becomes the number you actually pay
Costs set a floor. They do not set the price. What sits between them is revenue management, and it follows a different logic entirely.
Once a flight is scheduled, the overwhelming majority of its cost is already committed. The aircraft is leased, the crew is rostered, the slot is held, the fuel is largely determined by the routing. The marginal cost of carrying one additional passenger in an empty seat is small: some fuel for the added weight, a meal, a per-passenger airport charge.
This asymmetry is the entire reason airline pricing looks irrational from the outside.
An airline will sell a late seat cheaply rather than fly it empty, and will price an identical seat far higher when demand data suggests the buyer will pay, because both decisions improve the same flight’s contribution against costs that were sunk the moment the schedule was published.
When costs rise sharply, carriers have two levers rather than one. They can raise fares, which demand may not absorb, or they can cut capacity, which raises load factors on the flights that remain. Brazilian carriers chose visibly from the second column this year: Azul cut around 5% of its capacity, naming São Paulo to Curitiba among the affected corridors, while LATAM reduced third-quarter capacity by three percentage points against plan and trimmed frequencies on the Rio to São Paulo shuttle, as Diário do Comércio reported.
Meanwhile the average real fare for a domestic ticket in Brazil reached R$ 632.53 in May, up 11.2% year over year, according to ANAC’s tariff data, a fraction of the fuel increase over the same period.
That gap between a 53% fuel increase and an 11% fare increase is the whole lesson. Costs did not pass through to price one for one. They passed through to schedule instead.
What a travel manager should take from all of this
Five practical conclusions follow from the structure above.
Fuel is the volatile line, so track it directly.
In Brazil it resets on the first of each month, which makes it one of the few cost shocks with a predictable calendar. A program that monitors it, whether through Petrobras announcements or IATA’s weekly jet fuel monitor, can anticipate fare and capacity movements a quarter ahead of seeing them in its own data.
Regulated charges are not negotiable, so separate them.
A rising average ticket that turns out to be a concession-contract inflation adjustment, of the kind ANAC publishes annually for each airport, is a different problem from a rising fare, and only one of the two responds to supplier negotiation.
Route competition matters more than list price.
Slot constraints, capacity cuts and hub concentration determine how much pricing power a carrier has on a specific city pair. A program flying two slot-constrained corridors will see cost behavior that no industry average predicts.
Distribution channel affects total cost.
With per-ticket charges varying by more than €15 between channels on some carriers, how a booking is made is now a real component of what it costs.
Currency exposure is carrier-specific.
Before assuming a dollar movement helps or hurts a supplier, check its functional currency. The answer differs between two airlines flying the same route.
The regional gap in all of this
Nearly every global figure in this article comes from data sets built primarily on North American, European and Asian carriers. The Latin American numbers exist, but they arrive through national regulators and individual airline filings rather than through an integrated regional picture, and the one comparative figure that does exist, fuel at 36.3% of costs in Latin America against 25.5% in North America, suggests the region’s cost structure is different enough that borrowed benchmarks will mislead.
A travel program in São Paulo, Bogotá or Santiago operates under a fuel share eleven points higher than its North American equivalent, a monthly regulated fuel repricing calendar with no equivalent in most markets, a concession-based airport charge regime with contractual inflation indexation, and a set of carriers whose functional currencies differ from one another.
None of that is captured by a global average. All of it shows up in the invoice.
About me

I am an entrepreneur with over 20 years of experience at the intersection of tourism and technology. I am co-founder and Chief Business Officer of VOLL, the largest mobile-first corporate travel and expense management platform in Latin America, where I lead the commercial strategy behind our AI adoption.
A first-cohort graduate of The AI-Powered Organization at Stanford Graduate School of Business and a Marketing specialist from Fundação Dom Cabral, I serve on the Tourism Council of FecomércioSP and on the Executive Council of the Latin American Association of Corporate Events and Travel Management (Alagev). I write and speak about innovation, digital transformation, entrepreneurial leadership, and the future of corporate travel.