



Start with a number. Corporate travel spending in Brazil is projected to grow 13.8% this year, the fastest rate among the fifteen largest business travel markets in the world, ahead of Australia, South Korea and Japan. That figure comes from the GBTA Business Travel Index, the eighteenth edition of the industry’s benchmark forecast, and in the same release Brazil shows up inside the global top ten by spend for the first time. The headline almost writes itself. Brazil is booming while much of the world crawls.
I want to be upfront before I go further, because a good part of what follows comes from a study my own company ran. I am co-founder and Chief Business Officer of VOLL, a corporate travel and expense management platform, and together with Visa and Panrotas we publish a study called Radar Business Travel, drawn from the anonymized patterns in our booking base. So read me as an interested party.
I will lean on the findings that are hard to dispute, the ones that come from millions of real trips, and I will tell you where every number came from.
The reason I think this is worth an outsider’s attention has nothing to do with national pride. It is that the Brazilian data quietly contradicts the simplest reading of its own headline, and the way it does that is a lesson for any company trying to measure its travel anywhere.
Brazil just entered the top ten, and it is outgrowing the giants
The global picture first, so the Brazilian one has a frame. GBTA expects worldwide business travel spending to reach a record 1.71 trillion dollars in 2026, up 7.2% over the prior year. Trip volume, though, is forecast to rise only 1.3%, to about 1.84 billion trips. That gap between spending and volume is the single most important thing in the global report, and business travel coverage has flagged it clearly: the money is climbing several times faster than the number of trips. People are not traveling much more. Each trip is simply costing more, or being counted more completely.
Against that backdrop, Brazil stands out. It is the fastest riser among the biggest markets at 13.8%, and it now ranks tenth in the world with roughly 35.8 billion dollars in corporate travel spending, according to Brazilian coverage of the same GBTA convention. GBTA ties part of the Brazilian surge to higher energy prices, and it credits the wider Americas with a lift from artificial intelligence and technology investment. All true, and all measured from 30,000 feet. The question that a global index is not built to answer is what that growth actually looks like on the ground. That is where our own base has something to add.
The map is moving toward the interior, not the capitals
Here is the first surprise. The growth is not concentrating in the big capitals. It is spreading inland.
São Paulo is still the country’s main corporate destination, holding about 27% of our domestic travel, but it lost almost a full point of share in a single year, and Belo Horizonte and Campinas slipped as well. Meanwhile the fastest climbs happened in places that rarely make a travel headline. Foz do Iguaçu rose 54%, the steepest among the destinations we track. Sinop, deep in the agricultural north of Mato Grosso, jumped 37%. Navegantes, on the logistics corridor of Santa Catarina, gained 25%, and Londrina 23%.
Among state capitals, João Pessoa and Aracaju both grew 51%, with Goiânia, Porto Alegre and Vitória close behind. These are cities wired to the real economy: grain, ports, energy, distribution.
Luiz put it to InfoMoney in a line I will borrow from myself, since I said it: Brazil is a continental country with an internalizing economy, and the decision still sits in the capitals while the work moves to the interior, which generates travel by its very nature. You can read the full InfoMoney report on the study here.
A factory audit happens where the factory is. A harvest is inspected where it grows. The center of gravity of corporate travel is drifting away from the postcard skylines and toward the places that actually produce.
Part of the growth is spending you can finally see

Now the part that matters most, and the reason I told you to watch the gap between spending and volume in the global numbers.
Some of Brazil’s growth is not new spending at all. It is spending that was always happening and is only now visible. For years, a large share of corporate travel cost in Brazil lived in the shadows: booked on an employee’s personal card, reimbursed weeks later through a spreadsheet, scattered across departments where no one could add it up. As companies professionalize travel management and move onto real platforms, that spend stops hiding. It shows up in the data as growth, even when the underlying behavior barely changed.
This is not only a Brazilian habit. Vendor research this year found that 53% of business travelers book outside their approved channels when the official tools fall short, and specialists now treat this kind of leakage as a structural blind spot rather than a discipline problem. Read the vendor framing with the usual caution and keep the number: in plenty of programs, more than half of the travel is invisible to the people who are supposed to own it.
When those companies finally pull that spend into view, their reported numbers jump, and almost none of it is behavior that just started.
I will quote myself again, because this is the sentence I most want a finance leader to sit with: part of the rise is the spending becoming visible, not the spending being born. The clearest evidence is in ground transport. In our base, land transport spending grew 25.1% between 2025 and 2026, far above air at 6.1% and hotels at 4.2%. Part of that is genuinely higher cost, from fuel, tolls and ride-hailing running ahead of inflation. Part of it is a shift toward executive coaches and car rental.
And part of it, a real part, is simply that expenses which used to evaporate into personal cards are now captured, categorized and counted.
This is the local face of the same story GBTA sees globally, where money rises far faster than trips. A number can go up because the world changed, or because your instruments finally started reading it. Telling those two apart is the whole job.
The road and the plane stopped competing
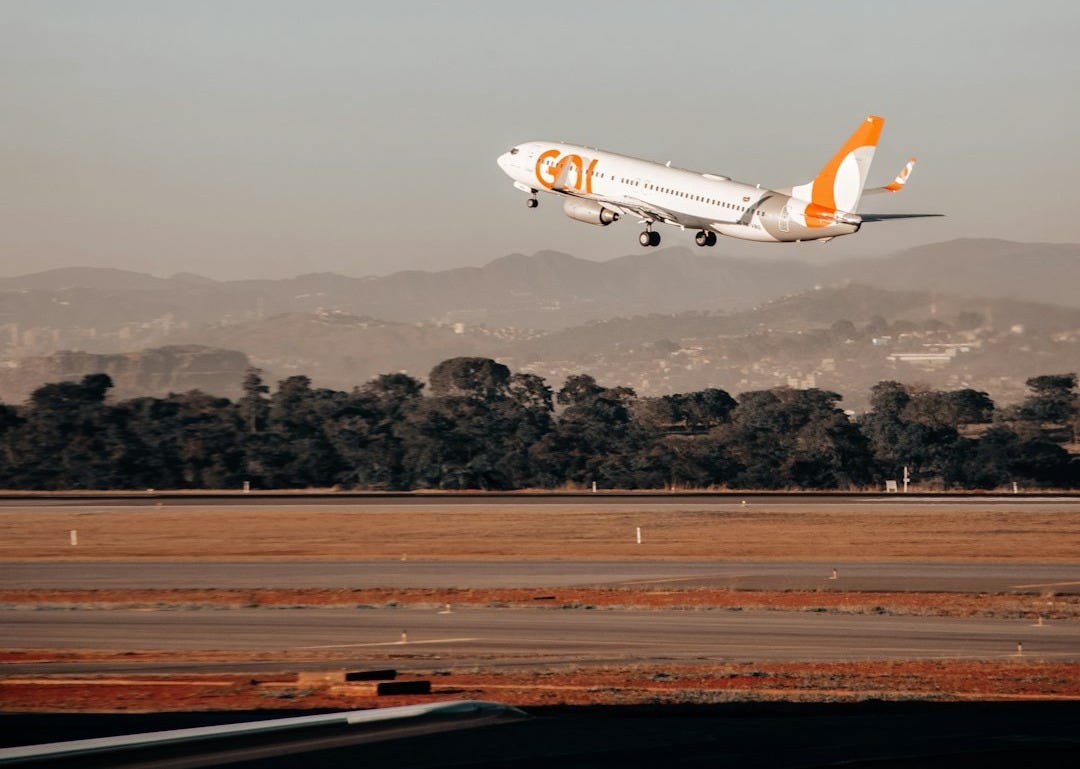
The interiorization runs on wheels as much as wings, and the relationship between the two is not what you would guess.
In our base, and the full breakdown sits in the same study, 63% of corporate road trips connect a capital to an interior city, another 25% run between inland cities, and trips between two capitals now account for less than 12%. Nearly nine in ten road trips have at least one end in the interior, and 59% happen inside a single state. The corridors that grew the most read like a map of Brazilian industry: Rio de Janeiro to Macaé for oil and gas, Belo Horizonte to the old mining towns of Minas, Cuiabá toward the north of Mato Grosso. The São Paulo to Campinas run more than doubled.
The tempting conclusion is that the bus is eating the plane. It is not. Short flights, the ones under 500 kilometers, grew at roughly 30% per segment, about the same pace as the longest routes. A route like Confins to Belo Horizonte barely existed in our base a year ago and now carries real volume as the final leg of trips that start in the air. What is happening is complementarity, not substitution.
The road fills in where there is no competitive flight, and increasingly serves as the last stretch of a journey that began on a plane. Any company writing a travel policy on the assumption that ground and air are rivals is solving the wrong problem.
The week tightened around Monday again
Travel is also reorganizing itself on the calendar, and this one I have a personal stake in.
Mondays accounted for 23.6% of corporate departures in 2026, the highest share in three years. Back in 2024, at the peak of hybrid-work enthusiasm, that figure had fallen to 20%. Fridays moved the other way, down from 16.8% to 14.2%. Same-day round trips shrank from 11.5% to 9%, while the average domestic trip stretched slightly, from 2.8 to 2.9 days, and the average hotel stay grew from 2.2 nights in 2022 to 2.5 in 2026.
The pattern is a traveler who leaves early in the week, stacks several meetings into one city or region, and comes home midweek. Fewer trips, each one carrying more weight, which is exactly the “intentional” posture that industry analysts have described for 2026.
My personal footnote is that I moved my own trips off Monday a while ago, after measuring that leaving on a Monday morning cost me almost 60% more than the same trip midweek. So I read the return of the Monday departure with mixed feelings. The market is front-loading the week for productivity, and paying the premium to do it. There is a real efficiency in solving three problems in one region across three days.
There is also a bill attached, and most companies never see it, because the premium is buried inside dozens of separate bookings that no one adds up. Which brings the argument back to where it keeps landing.
What a global index cannot see

The GBTA number will travel. Brazil, plus 13.8%, fastest among the giants is a clean line for a slide, and it is accurate. But it is also blind to everything that makes the growth interesting. It cannot see that the map is moving inland, that road and air have become partners rather than competitors, that the week is bending back toward Monday, or that a real slice of the increase is visibility rather than volume.
It cannot see that technology companies were the single largest driver of air-travel growth in our base, at about 20%, ahead of food and beverage, heavy industry and retail, which is its own quiet signal about where the Brazilian economy is placing its bets. And it cannot see that even with international trips rising from 4.5% to 6.3% of the base, more than 90% of the corporate flying here still happens inside the country.
None of that is a criticism of the index, whose executive summary is careful about its own scope. A global benchmark is supposed to be coarse. The lesson is for the company reading it. Your own travel program is a version of the same problem at smaller scale. The headline growth on your dashboard is only as honest as the share of spend your channel actually captures, and in most organizations that share is far lower than anyone admits.
The trips booked around the system, the receipts that never reconcile, the ground transport paid on a personal card in a town you did not know your team was visiting, all of it is growth you already have and cannot see.
So take the 13.8% and enjoy it. Then ask the harder question, the one Brazil’s own data keeps posing to the country that produced it. How much of your travel is actually growing, and how much of it were you simply never able to measure before? In a market moving this fast, toward places this dispersed, the difference between those two is not academic. It is the difference between managing your travel and merely watching the parts of it that happen to be visible.
About me

I am an entrepreneur with over 20 years of experience at the intersection of tourism and technology. I am co-founder and Chief Business Officer of VOLL, the largest mobile-first corporate travel and expense management platform in Latin America, where I lead the commercial strategy behind our AI adoption.
A first-cohort graduate of The AI-Powered Organization at Stanford Graduate School of Business and a Marketing specialist from Fundação Dom Cabral, I serve on the Tourism Council of FecomércioSP and on the Executive Council of the Latin American Association of Corporate Events and Travel Management (Alagev). I write and speak about innovation, digital transformation, entrepreneurial leadership, and the future of corporate travel.